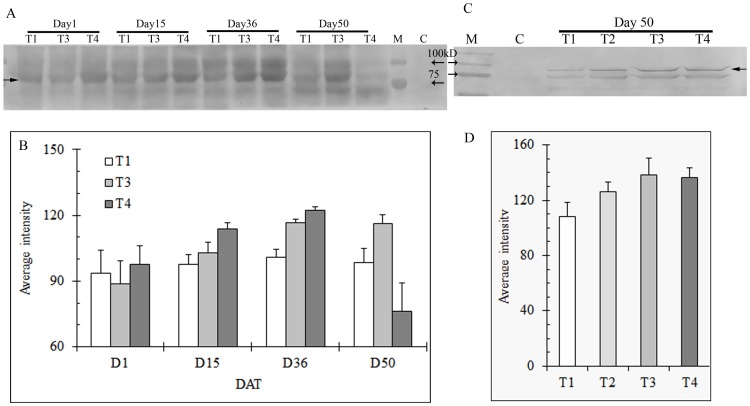
Figure 4. Expression of HSP90 in shoots (A) and roots (C) of heat stressed creeping bentgrass under different N levels using immunoblot and correponding band intensity of HSP90 in shoots (B) and roots (D) using Bio-rad Quantity One software.
T1, T2, T3, and T4 represents the treatments of no N, low N, medium N, and high N, respectively. Shoot samples of low N treatment (T2) were omitted in protein gel blot analysis in order to accommodate all the samples across different sampling days on a same gel.M: protein standard for molecular weight; C: sample before heat stress. Equal amounts of protein (40 µg) were loaded to each lane. Solid arrow indicates the HSP, and the open arrow(s) indicate protein standard. Bars indicate standard error of means of different samples in replicate treatments (n = 3).

