
Figure 1. Gray matter volume reductions in whole brain analysis.
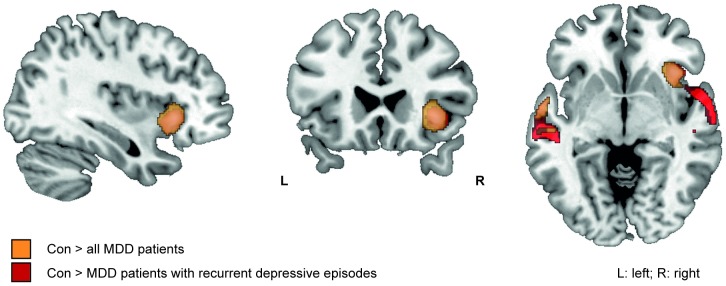
Gray matter volume reductions in all MDD patients versus healthy controls (orange), and patients with recurrent depressive episodes versus healthy controls (red) (Table 3). (Whole brain analyses, p<0.001, k = 139; view: MNI: 36 23 -5).