
Figure 3. Number of depressive episodes is negatively correlated with the right hippocampal gray matter volume.
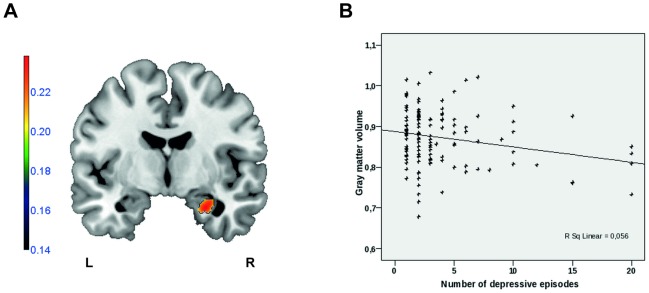
A: Sagittal view (MNI x = −6) depicting gray matter volumes correlating with number of depressive episodes. (Region-of-interest analyses, p<0.01, k = 109; Color bar represents negative correlation coefficient -r. (L: left; R: right)). B: Scatter plot depicting the negative correlation (r = −0.237; p = 0.006) of the right hippocampal cluster values (left panel) and the number of depressive episodes (SSPS Statistics 15.0 software package).