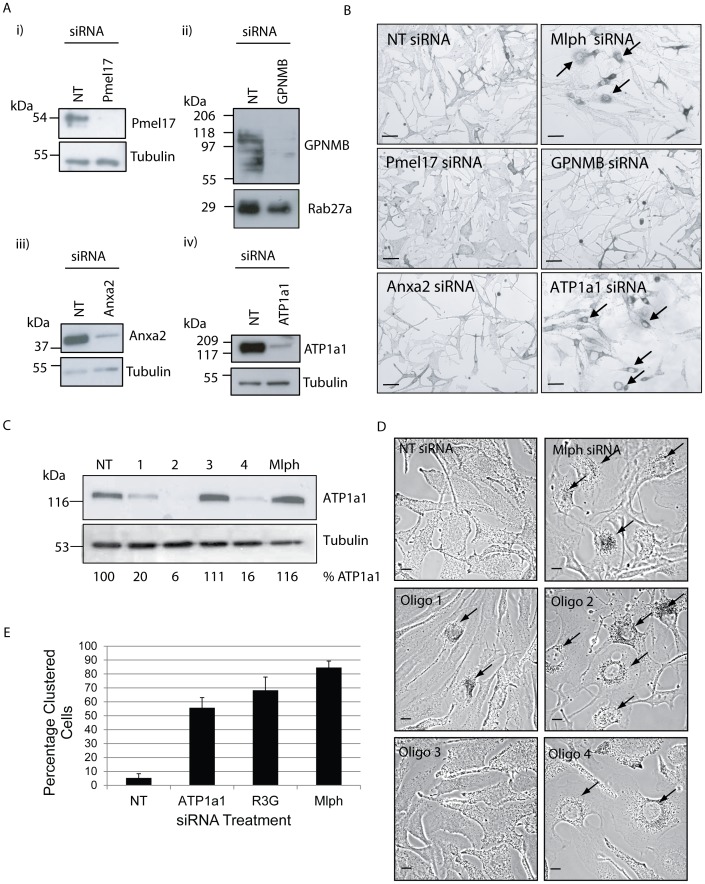
Figure 2. Candidate protein depletion and effects on melanosome distribution.
Melan-INK4a cells were treated with siRNA pools for NT, Pmel17, GPNMB, Anxa2, ATP1a1 (A+B) or individual siRNAs for NT, ATP1a1 (1–4) or Mlph for 72 h (C+D). A) Candidate protein depletion was assessed by immunoblotting the PNS with antibodies for the candidate protein and using tubulin or Rab27a as a loading control. B) Melanosome distribution was visualised using a light microscope. Mlph siRNA depletion was used as a positive control for melanosomes clustering. Arrows indicate cells with clustered melanosomes. Scale bar represents 100 µm. C) ATP1a1 depletion was assessed by immunoblotting the PNS with antibodies to ATP1a1 and Tubulin. Depletion was quantified by measuring band intensities using ImageJ, normalised to tubulin loading control and the percentage protein quantified relative to NT siRNA control. D) Melanosome distribution was visualised using a confocal microscope. Mlph was used as a positive control for melanosomes clustering. Arrows indicate cells with clustered melanosomes. Scale bar represents 10 µm. E) The percentage of clustered cells was quantified from three independent experiments, 2 separate coverslips per condition and counting a minimum of 100 cells per coverslip. Error bars are standard deviation.

