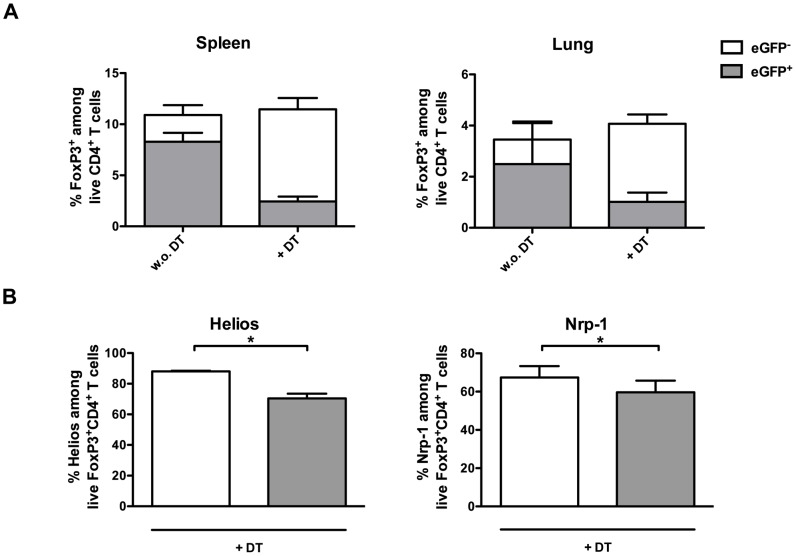
Figure 5. eGFP− diTregs rapidly replenish the pool of Tregs in M. bovis BCG infected DEREG mice.
DEREG mice were infected i.v. with 2×10⁶ CFU M. bovis BCG and treated, or not, with DT on days 7/8 and 14/15 p.i. and (A) the percentage of eGFP+ (grey)- and eGFP− (white) Foxp3+CD4+ Tregs cells in the spleen (left) and lungs (right) or (B) the expression of the thymic Treg markers Helios (left) and Nrp-1 (right) in the eGFP+ (grey) and eGFP− (white) Treg population were analysed in the spleen at day 20 p.i. in DT-treated mice. Bar graphs represent mean ± SD of 3–5 mice per group. N = 3. Statistical analysis: Mann-Whitney-U-Test. *p<0.05; **p<0.01; and ***p<0.001.

