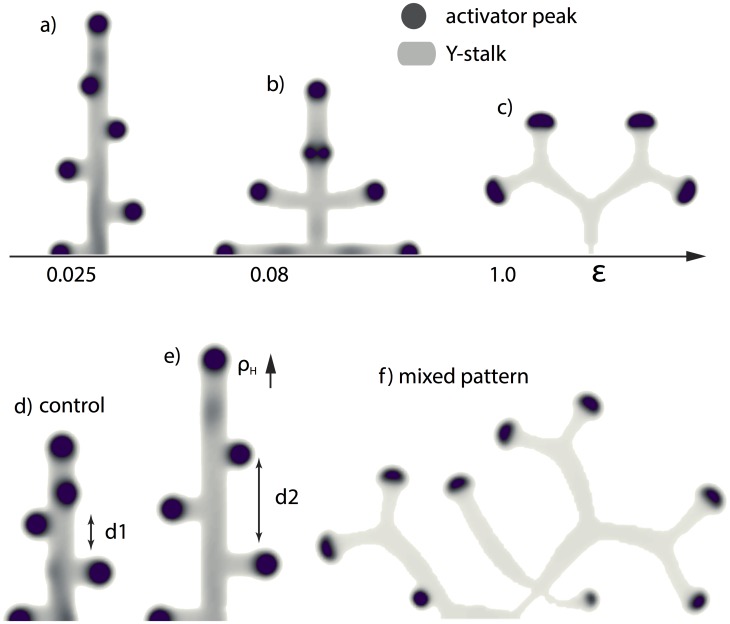
Figure 2. Different branching patterns produced by altering key parameters.
(a, b, c) as one of the key parameters  gradually increases, the branching mode produced by the full model changes from (a) side branching with left-right alternating order to (b) side branching with symmetry, and then to (c) tip splitting.
  = 0.0001 and
  = 0.025/0.08/1.0 from left to right respectively. (d, e) as another key parameter
  increases, the spatial distance between side branches increased.
  = 0.025,
  goes from 0.000025 to 0.0002. (f) mixed pattern formation of tip splitting and side branching, when
  = 0.85,
  = 0.00003, and and
  = 0.004. Parameters:
  = 0.002,
  = 0.16,
  = 0.04,
  = 0.03,
  = 0.02,
  = 0.02,
  = 0.008,
  = 0.1,
  = 10,
= 10,  = 0.02,
  = 0.26,
  = 0.06.

