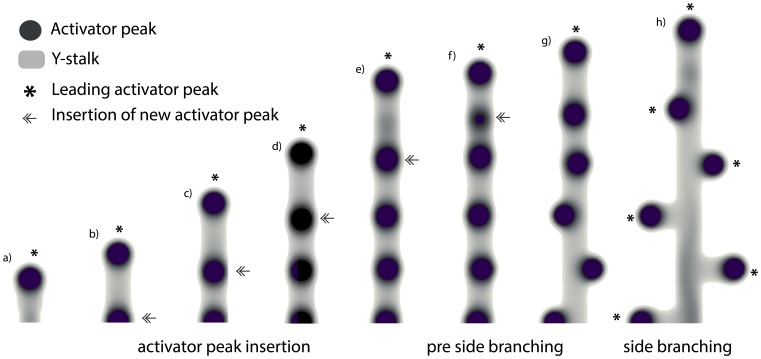
Figure 3. Periodic activator peaks along the Y-stalk determines pre branch sites.
(a) the leading activator peak emerges at the growing tip, marked by *. (b) Forward migration of the leading activator peak produces the elongation of the Y-stalk. When enough space is created behind the leading activator peak, a new activator peak will be induced right behind it, marked by double arrow. (c–f) After several rounds of peak insertion, activator peaks line up along the Y-stalk. (g, h) later on, these activator peaks migrate out in the transversal direction, each of which becomes the leading activator peak of the newly formed side branches, marked by *. Parameters:  = 0.002,
  = 0.16,
  = 0.04,
  = 0.03,
  = 0.0001,
  = 0.02,
  = 0.02,
  = 0.0025,
  = 0.008,
  = 0.1,
  = 10,
= 10,  = 0.02,
  = 0.26,
  = 0.06.

