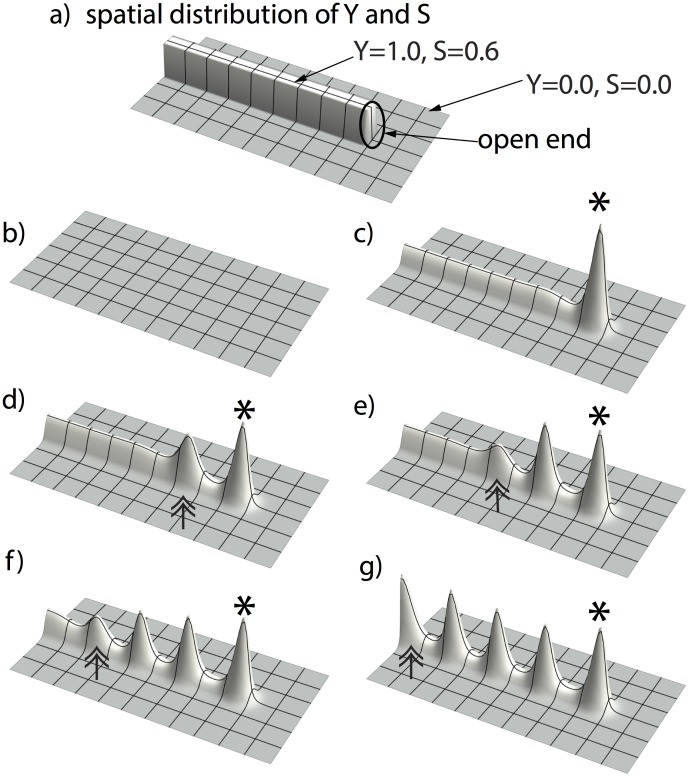
Figure 4. Activator peaks march inward and evolve periodic patterns along the YS domain.
(a) initial condition of Y and S: high concentrations (Y = 1.0 and S = 0.5) inside the rectangle (5 space steps wide ×80 space steps long) and low concentrations (Y = 0.0 and S = 0.0) outside that rectangle. (b, c) a first activator peak emerges at the open end of the rectangularly-shaped YS domain, marked by the asterisk. (d, e, f, g) this first activator peak induces new activator peaks to form along the YS domain, marked by double-arrows, in a wave-like manner, until the YS domain is filled up. Parameters:  = 0.002,
  = 0.16,
  = 0.04,
  = 0.03,
  = 0.0001,
  = 0.02,
  = 0.26.

