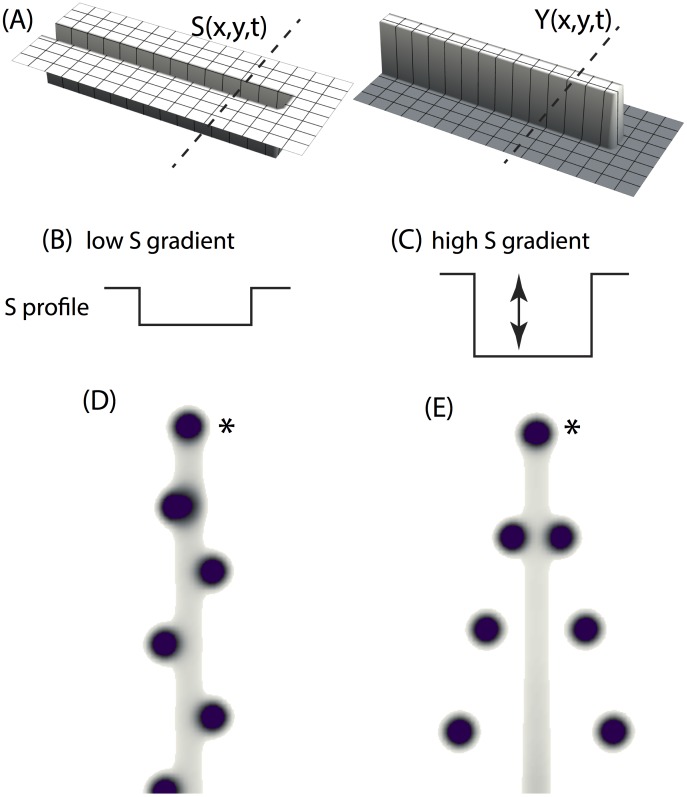
Figure 9. Migration of activator peaks in the transversal direction.
(a) snapshot of YS domain (the YS domain is growing over time as in figure 7). Morphogen concentration is denoted as z-axis height. Substrate has relatively low values inside the growing rectangle, and relatively high outside the growing rectangle. Y equals to 1.0 inside the rectangle and equal to 0.0 outside that rectangle. The initial rectangular is 5 space steps wide by 10 space steps long. The length of the rectangular increases one space step every 10,000 time steps. Space step dx = 0.3, time step dt = 0.4dx2. (b, c) profile of S along the dotted line as shown in panel a. The high/low value of S profile is 1.0/0.6 and 1.0/0.4 in panel b and c. Activator peaks migrate out of the YS domain in a left-right order and a symmetrical manner under condition b and c respectively.

