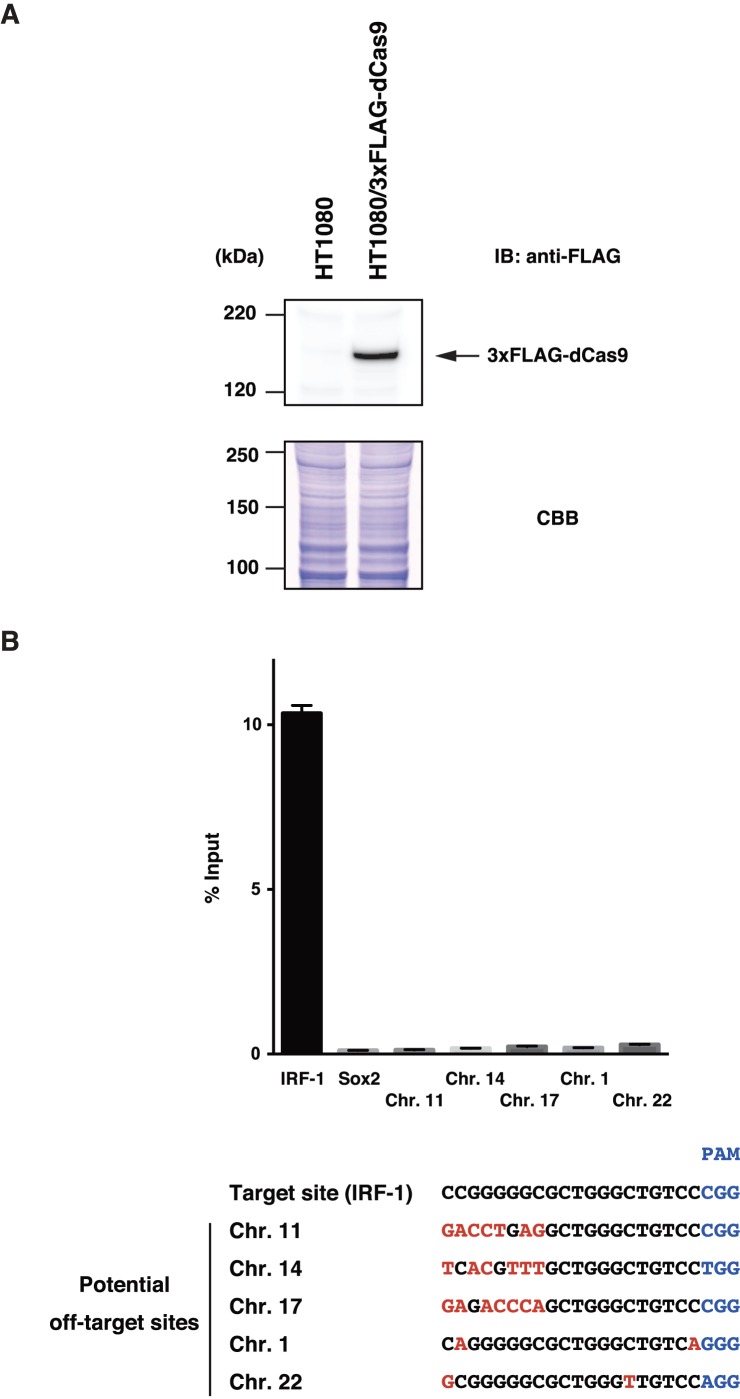
Figure 1. Yield of enChIP analysis for the target site and potential off-target sites.
(A) Expression of 3xFLAG-dCas9 in HT1080-derived cells. Expression of 3xFLAG-dCas9 was detected by immunoblot analysis with anti-FLAG Ab. Coomassie Brilliant Blue (CBB) staining is shown as a protein loading control. (B) Upper panel: Yield of enChIP analysis for the target site and potential off-target sites (mean +/- SD, n = 3). Lower panel: Alignment of the target site and potential off-target sites. The PAM sequences and mismatches are shown in blue and red, respectively.

