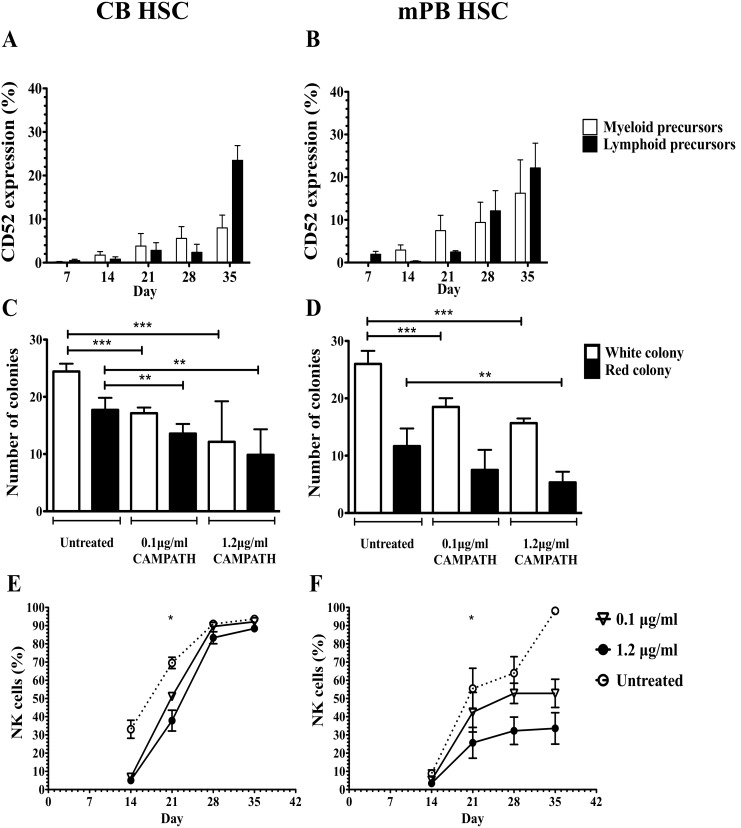
Figure 6. CD52 expression and effects of CAMPATH on HSC and HSPC.
A and B show the level of CD52 expression in CD45high/low lymphoid and myeloid progenitors in cultures of CB and PB HSC respectively. C and D show the number of colony from CB SC and mPB SC respectively at day 14. E and F show the percentage of NK cells formed during the 35 days of culture of CB SC and mPB SC respectively. *represents p value<0.05, **represents p value<0.005, ***represents p value<0.005 (n = 3).

