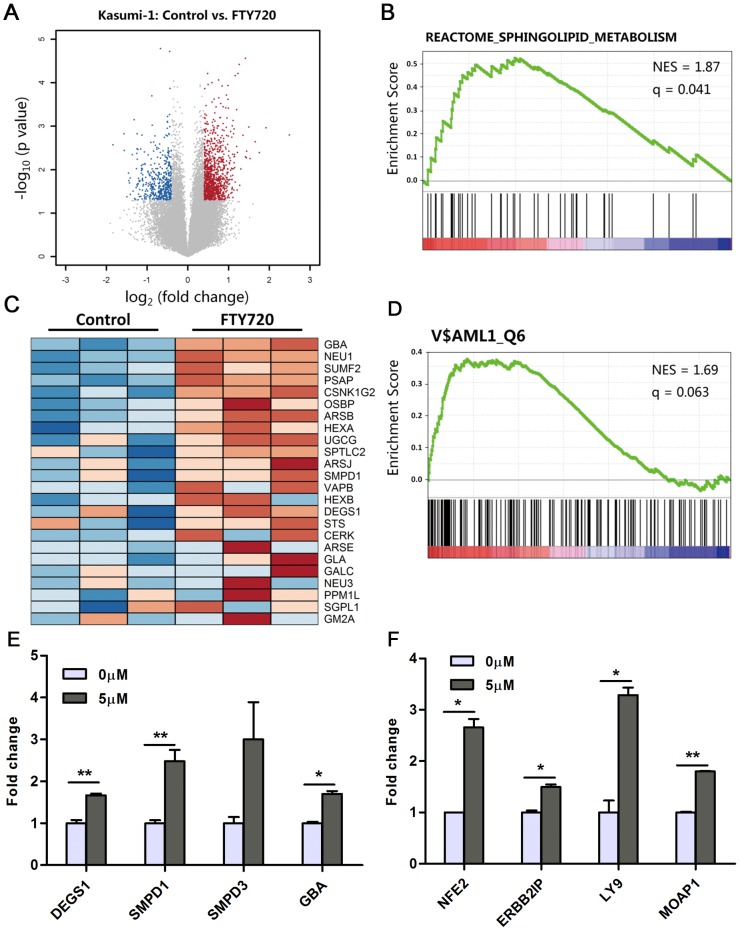
Figure 5. Gene expression profile analysis of FTY720 treated Kasumi-1 cells.
(A) Volcano plots of gene expression differences for Kasumi-1 cells treated with FTY720 for 6 hours. Blue dots represent gene probes with P value <0.05 by t test and down-regulated fold change >1.5 (log2FC<−0.58). Red dots represent gene probes with P<0.05 and fold change >1.5 (log2FC>0.58). Gray dots represent gene probes with P>0.05 or fold change <1.5 (B) Gene Set Enrichment Analysis of sphingolipid metabolism signature. The enrichment is depicted by FDR q value and NES. (C) Heat map of the core enrichment genes (subset of genes that contributes the most to the enrichment result) in sphingolipid metabolism. (D) Gene set enrichment analysis of AML1 transcription factor signature. The enrichment is depicted by FDR q value and NES. (E, F) Kasumi-1 cells were treated with 5 µM FTY720 for 6 h, and RNA was extracted from cells. qRT-PCR was used to analyzetranscription of genes of ceramide synthesis pathway (E) and AML1 targets (F). *P<0.05, **P<0.01.

