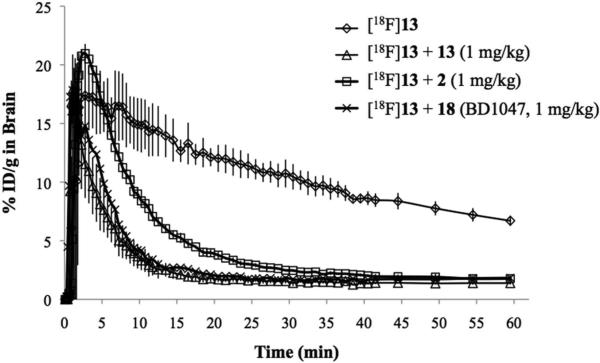
Figure 4.
Time activity curves (TACs) from mouse positron emission tomography (PET) studies. TACs represent accumulation of [18F]13 in whole mouse brain as a function of time for baseline (n=3), pre block with 2 (n=3), pre block with 13 (n=3), and pre block with 18 (n=3). Baseline studies involved iv administration of [18F]13 (95-125 μCi), whereas blocking studies involved pre-treatment of mice with either 2 (1 mg/kg), 13 (1 mg/kg) or 18 (1 mg/kg) 10 min prior to iv administration of [18F]13 (95-125 μCi).

