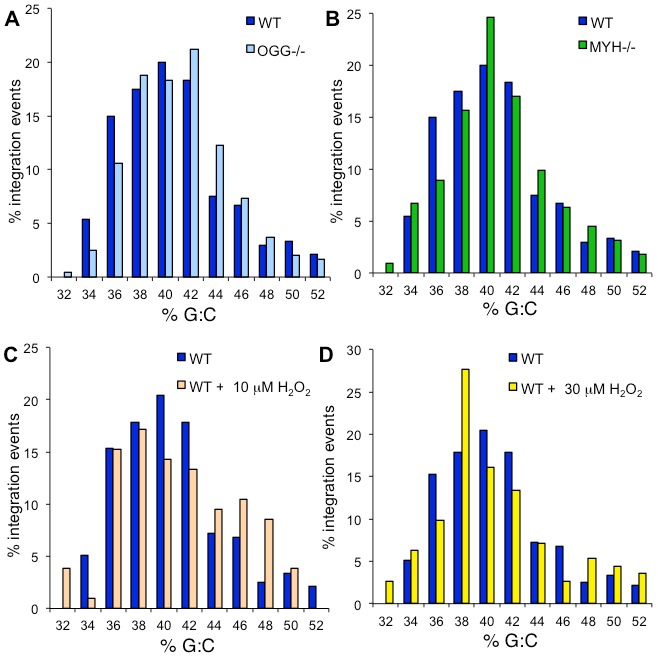
Figure 6. G:C content surrounding HIV integration sites.

The percentage of HIV integration sites compared to the percentage of G:C base pairs within a 5 kb window is shown for wild type cells compared to (A) OGG1 null cells, (B) MYH null cells, (C) wild type cells treated with 10 µM H2O2, and (D) wild type cells treated with 30 µM H2O2. The frequency of G:C base pairs in the mouse genome is 0.41. There is no significant difference between HIV integration sites in untreated wild type cells and OGG1 null (p = 0.96), MYH null (p = 0.99), 10 µM H2O2 treated (p = 0.67), or 30 µM H2O2 treated cells (p = 0.88).
