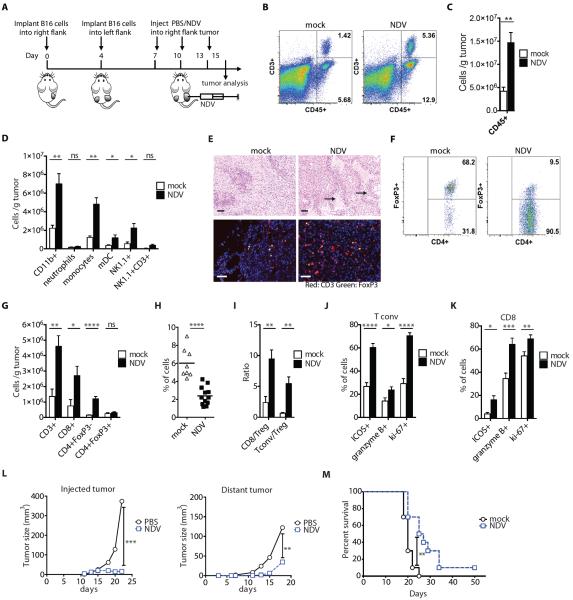
Figure 1. NDV increases distant tumor lymphocyte infiltration and delays tumor growth.
(A) Treatment scheme. (B) Representative flow cytometry plots of percentages of tumor-infiltrating CD45+ and CD3+ cells. (C) Absolute numbers of CD45+ cells/g tumor. (D) Absolute numbers of innate immune cells/g tumor. (E) Tumor sections from distant tumors were stained with H&E (upper panels) or labeled for CD3 and FoxP3 (bottom panels) and analyzed by microscopy. Areas denoted by arrows indicate areas of necrosis and inflammatory infiltrates. Scale bars represent 200 μm. (F) Representative flow cytometry plots of percentages of CD4+FoxP3+ (Treg) and CD4+FoxP3− (Tconv) cells. (G) Absolute numbers of conventional and regulatory CD4+ cells and CD8+ cells/g tumor calculated from flow cytometry. (H) Relative percentages of Tregs out of CD45+ cells. (I) Calculated Tconv/Treg and CD8+/Treg ratios. (J,K) Upregulation of ICOS, Granzyme B, and Ki-67 on tumor-infiltrating Tconv (J) and CD8+ cells (K). (L) Growth of NDV-injected and distant tumors. (M) Overall animal survival. Data represent cumulative results from 3 (B–K) or 2 (L–M) independent experiments with n=3–5 per group. Mean +/− SEM is shown. *p<0.05, **p<0.01, ***p<0.001, ****p<0.0001.

