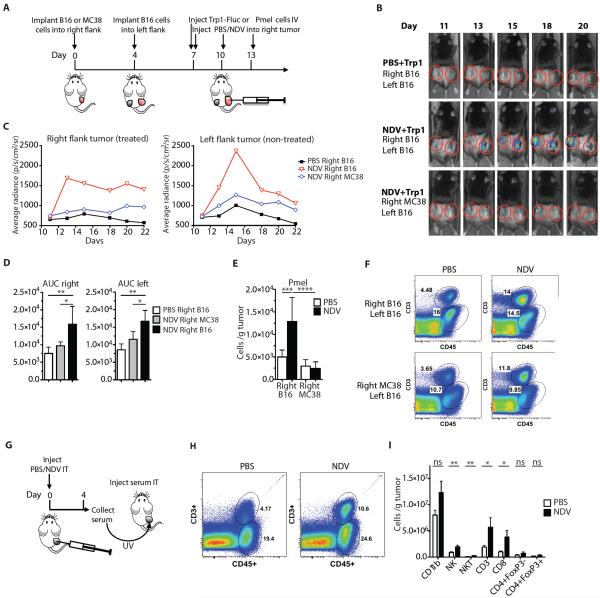
Figure 2. NDV induces infiltration of tumor-specific lymphocytes and facilitates tumor inflammation.
(A) Treatment scheme. (B) Representative luminescence images from animals treated with NDV and adoptively-transferred Trp1-Fluc lymphocytes. (C) Quantification of average luminescence from the tumor sites. (D) The area under the curve (AUC) calculated from the data in panel (C). (E) Absolute number of Pmel lymphocytes from distant tumors calculated from flow cytometry. (F) Representative flow cytometry plots of percentages of CD45+ and CD3+ cells infiltrating distant tumors of animals treated per treatment scheme in panel (A). (G) Experimental scheme for serum transfer from animals treated intratumorally with single injection of NDV or PBS. (H) Representative flow cytometry plots of percentages of CD45+ and CD3+ cells infiltrating serum-injected tumors. (I) Absolute numbers of the indicated cell subsets in serum-injected tumors calculated from flow cytometry. Data for panels B–E represent 1 of 3 experiments with n=4–5 per group. Data for panels G–I represent pooled data from 2 independent experiments with n=5 per group. Mean +/− SEM is shown. *p<0.05, **p<0.01, ***p<0.001, ****p<0.0001.

