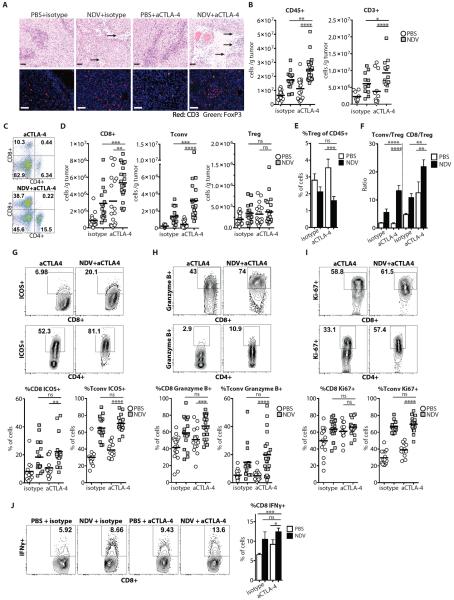
Figure 5. Combination therapy with NDV and CTLA-4 blockade induces inflammatory changes in distant tumors.
Animals were treated per schema in Fig. 3A. Tumors were harvested on day 15 and analyzed for infiltrating immune cells. (A) Tumor sections from distant tumors were stained with H&E (upper panels) or for CD3 and FoxP3 (lower panels) and analyzed by light and fluorescence microscopy, respectively. Areas denoted by arrows indicate necrosis and inflammatory infiltrates. Scale bars represent 200 μm. (B) Absolute number of tumor-infiltrating CD45+ and CD3+ cells/g tumor calculated from flow cytometry. (C) Representative flow cytometry plots of percent of tumor-infiltrating CD4+ and CD8+ cells gated on CD45+ population. (D) Absolute numbers of Tconv, Treg, and CD8+ cells per gram of tumor. (E) Relative percentages of tumor-infiltrating Tregs out of CD45+ cells. (F) Calculated Tconv/Treg and CD8+/Treg ratios. (G–I) Upregulation of ICOS, Granzyme B, and Ki-67 on tumor-infiltrating CD8+ and Tconv lymphocytes. Representative flow cytometry plots (upper panels) and cumulative results (bottom panels) are shown. (J) TILs were restimulated with DC's pulsed with B16-F10 tumor lysates, and IFNγ production was determined by intracellular cytokine staining. Representative flow cytometry plots (left panel) and cumulative results (right panel) are shown. Data represent cumulative results from 5 (A–I) or 2 (J) independent experiments with n=3–5 per group. Mean +/− SEM is shown. *p<0.05, **p<0.01, ***p<0.001, ****p<0.0001.

