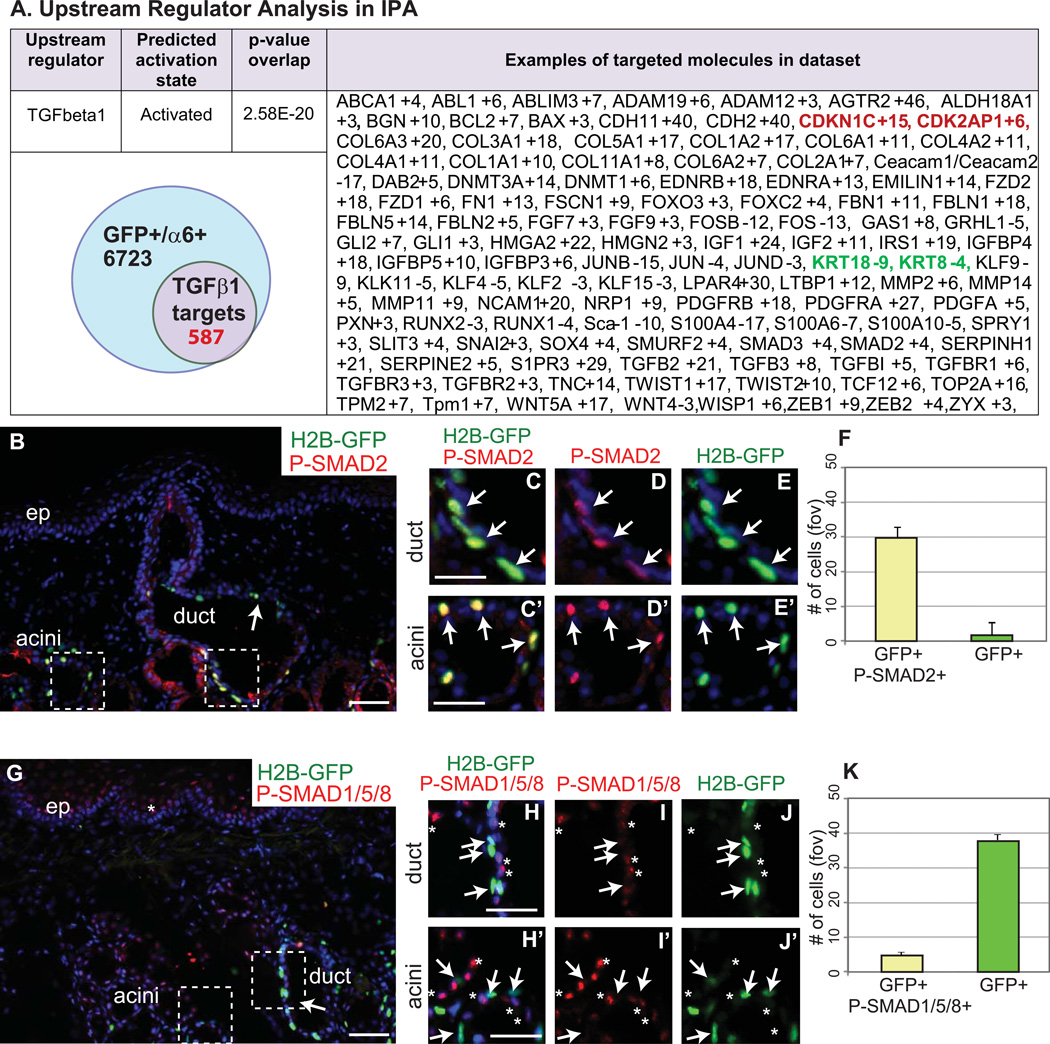
Figure 5. Activation of TGFβ signaling pathway in minor salivary glands LRCs and BMP pathway in early progenitors.
Upstream regulator analysis in IPA. Venn diagram showing known TGFβ targets (IPA database) that are differentially expressed in minor SG LRCs, examples of those genes are shown in table (A). Active TGFβ signaling is found in minor SG LRCs indicated by positive phospho-Smad2 expression (B–F). Active BMP signaling is found in minor SG non-LRCs indicated by positive phospho-Smad1/5/8 expression (G–K). The number of phospho-Smad2 and phospho-Smad1/5/8 cells and overlap with GFP positive cells is shown in F and K, respectively. Scale bar: B and G 50µm; C–E’ and H–J’ 20µm. Arrows denote GFP positive LRC, asterisk indicate non-LRCs. Abbreviations: ep, epithelium; fov, field of view.

