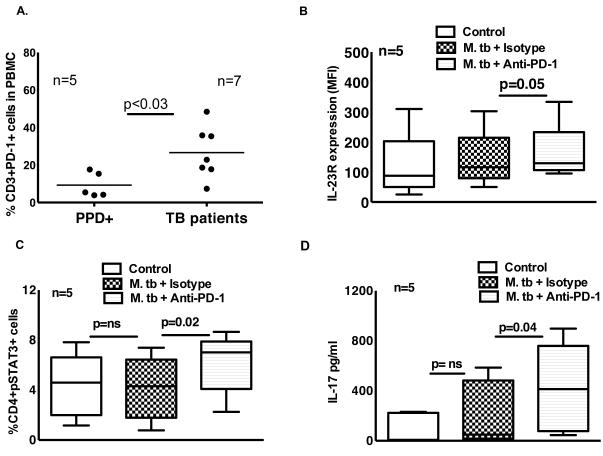
Figure 6. Effect of PD-1 on pSTAT3, IL-23R expression and IL-17 production by tuberculosis patients.
A. PD-1 expression by freshly isolated CD3+ cells. Freshly isolated PBMC from 5 PPD+ individuals and 7 tuberculosis patients were stained for CD3+ and PD-1+ cells. Five independent experiments were performed. CD4+ cells and autologous monocytes from PBMCs of tuberculosis patients were cultured with γ-irradiated M. tb H37Rv, in the presence of PD-1 antibody (10 μg/ml) or isotype antibody. After 96 h, B. Surface staining for CD4+ cells and IL-23R was performed. Five independent experiments were performed. C. CD4+pSTAT3+ cells were measured by flow cytometry. Five independent experiments were performed. D. IL-17 production in culture supernatants was measured by ELISA. For panels B, C and D the horizontal line shows the median, the boxes show the 25th and 75th percentile values, and the whiskers show the 5th and 95th percentile values. Five independent experiments were performed. Paired and unpaired t tests were performed. Mean values, p values and number of donors (n) is shown in panel A. Maximum, minimum and median values, p values and number of donors (n) are shown in panels B, C and D.

