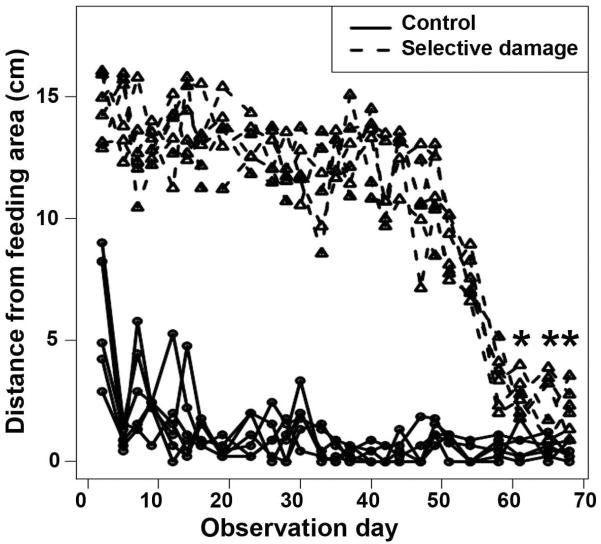
Figure 2.
Visual recovery following selective destruction of inner retinal neurons. Figure shows the positions of 14 month-old fish in the tank in response to a hand waved near the feeding area. Round symbols indicate positions of untreated control fish (near the feeding area), triangular symbols indicate positions of fish subjected to selective damage to inner retinal neurons. The positions of treated fish were significantly different from the positions of control fish until observation day 61 and beyond, indicating blindness followed by restoration of vision at 61 days (p<0.05; Simultaneous Tests for General Linear Hypotheses (Hothorn et al., 2008). In this figure, the asterisks (*) indicate the lack of significant difference between the two groups.

