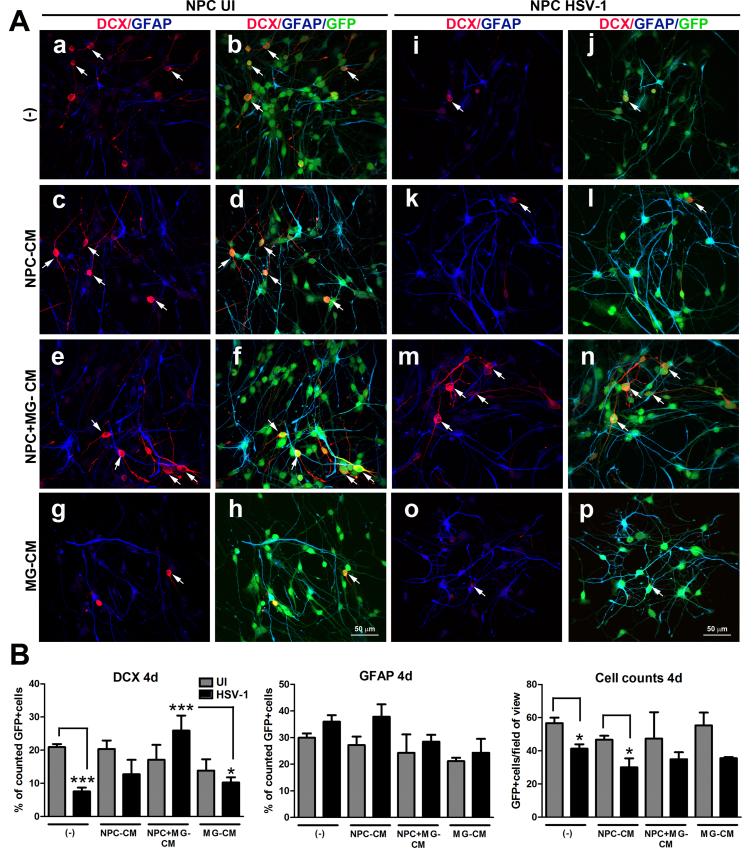
Figure 8. Conditioned media from NPC-microglia co-cultures prevents the specific loss of the DCX+ neuroblasts in NPC differentiated cultures infected with HSV-1.
NPCs were seeded on Matrigel matrix covered plates in EGF free media and 3 h later, the cultures were infected with HSV-1 (MOI=10−4) for 1h or left uninfected (UI). Next, the media was removed from each well, and cultures were supplemented with 1 ml of conditioned media from 2 day old NPC-microglia cultures (NPC+MG-CM) or an equal amount of 2 day old conditioned media from NPC only (NPC-CM) or microglia only (MG-CM) cultures. Other control cultures received fresh media (−). At 4 days pi, cultures were fixed and immunostained for neuroblast (DCX) and astrocyte (GFAP) -specific markers. (A) Representative confocal images for the quantitative findings in (B), where the bar graphs show the percentage of positive cells for each marker ±SEM and the averaged absolute number of cells per field of view ±SEM. The selective decrease in the percentage of DCX+ cells in no CM-, NPC-CM-, and MG-CM- treated cultures was blocked only in the NPC cultures treated with NPC+MG-CM. The data presented in B were obtained from counting 5-7 fields of view within a sample for each cell marker in 2 independent experiments (4 total replicates per measurement). DCX day 4 (4d) graph: a) ***p<0.0001 comparing infected NPC with no CM (−) to uninfected NPC with no CM (−), b) ***p<0.0001 comparing infected NPC treated with NPC+MG− CM group to infected NPC with no CM (−), and c) *p<0.01 comparing NPC HSV-1-treated group with MG-CM to NPC HSV-1-treated group with NPC+MG-CM; in the Cell counts day 4 graph: a) *p<0.01 comparing infected NPC with no CM (−) to uninfected NPC with no CM (−) and b)) *p<0.01 comparing infected NPC treated with NPC-CM to uninfected NPC treated with NPC-CM by ANOVA followed by Bonferroni’s multiple comparison test. White arrows in A depict DCX+ cells (stained in red).

