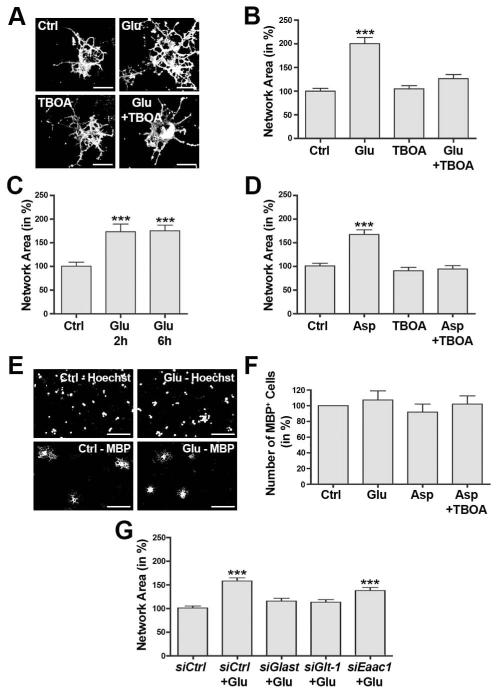
FIGURE 2.
Activation of sodium-dependent glutamate transporters promotes the morphological aspects of oligodendrocyte differentiation. A-F: Differentiating oligodendrocytes were treated for 6h (unless noted otherwise) as indicated: control (Ctrl), L-glutamate (Glu, 100 μM), a non-transportable inhibitor of sodium-dependent glutamate transport (TBOA, 100 μM), D-aspartate (Asp, 100 μM). A: Representative images of differentiating oligodendrocytes immunostained using O4 hybridoma supernatants. Scale bars: 20 μm. B-D: Bar graphs representing quantitative analyses of oligodendrocyte network areas (Dennis et al. 2008). Data represent means ± SEM (***p≤0.001 compared to control, ANOVA). E: Representative images of differentiating oligodendrocytes stained with an antibody specific for myelin basic protein (MBP) as well as with Hoechst 33342 (Hoechst) to visualize nuclei. Scale bars: 100 μm. F: Bar graph depicting the number of MBP immunopositive cells normalized to the number of Hoechst-positive nuclei. Data represent means ± SEM. ANOVA revealed no statistically significant difference (p≤0.05). G: Bar graph depicting oligodendrocyte network areas upon siRNA-mediated knock-down of individual sodium-dependent glutamate transporters (as indicated) and subsequent treatment with L-glutamate (Glu, 100 μM). Data represent means ± SEM (***p≤0.001 compared to siCtrl non-treated, ANOVA).

