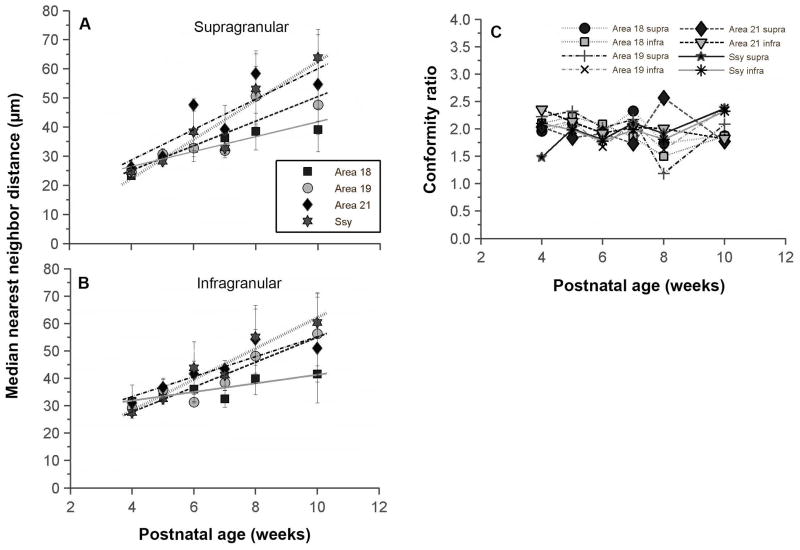
Figure 7. Age dependent increase in the median nearest neighbor distance (NND) between feedback cells in the juvenile ferret visual cortex.
A, B: Median nearest neighbor distance between feedback cells in the supragranular (A) and infragranular (B) layers of areas 18, 19, 21, and Ssy as a function of age. Median NND increases monotonically at the same rate in all areas. Regression lines are plotted for each visual area. Error bars represent ±SEM C: Conformity ratio (mean NND/Standard deviation of NND) in supra- and infragranular layers of each area as a function of age. This measure of regularity of spacing between feedback cells remains unchanged with age, and provides no strong evidence for a nonrandom distribution of cells.

