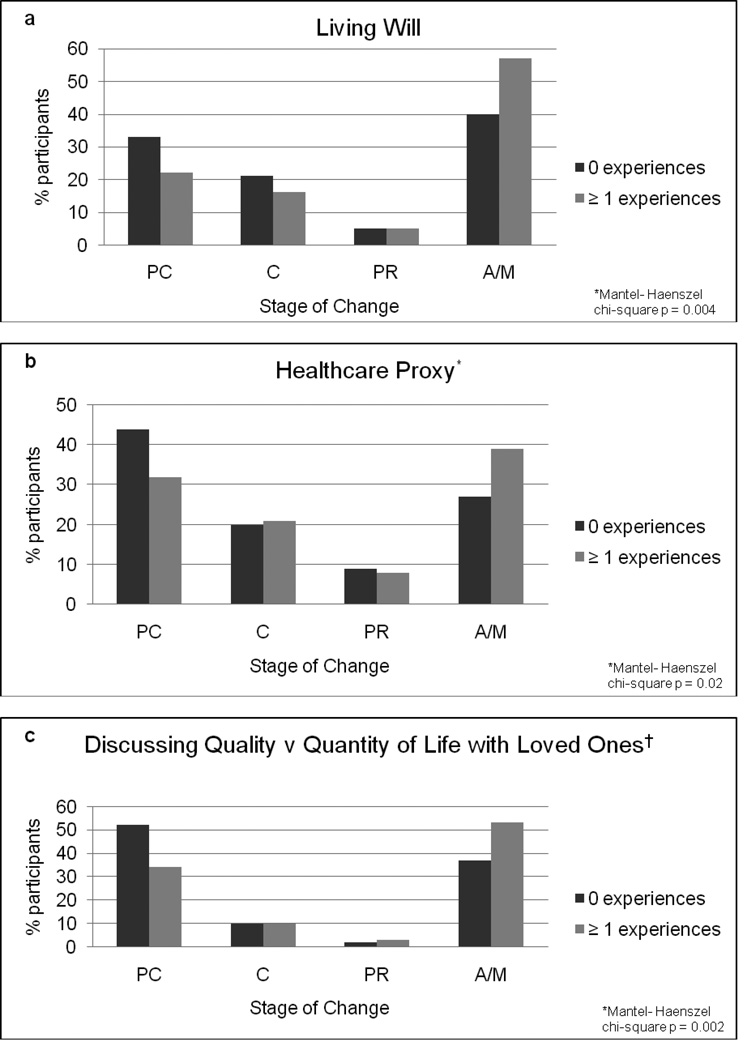
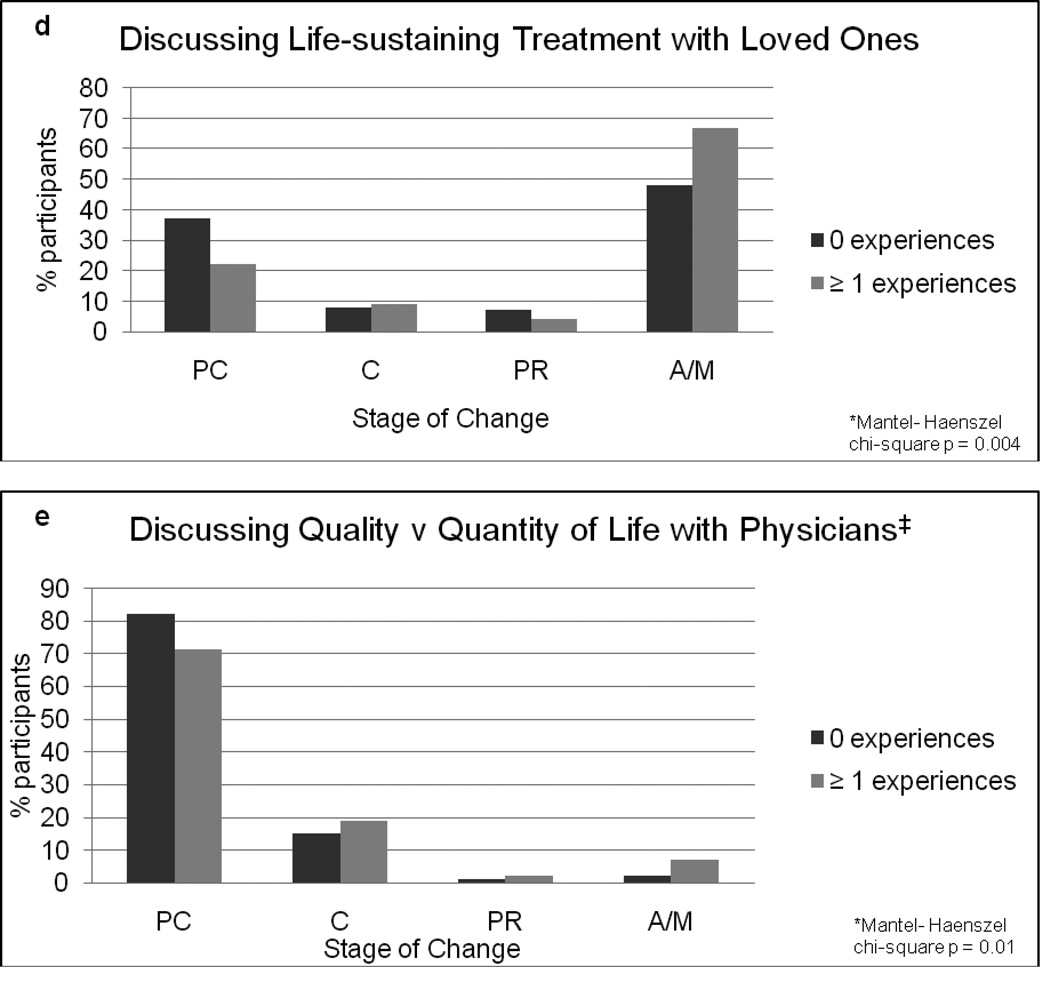
Figure 1.
(a–e): Stages of change for different ACP behaviors according to number of end-of-life care experiences with others. The light gray bars represent the percentage of participants with one or more end-of-life care experiences with others. The dark gray bars represent the percentage of participants with no prior end-of-life care experiences.
PC=pre-contemplation, C=contemplation, PR=preparation, A=action, M=maintenance
*Data missing for two participants.
†Data missing for one participant.
‡Data missing for five participants.


