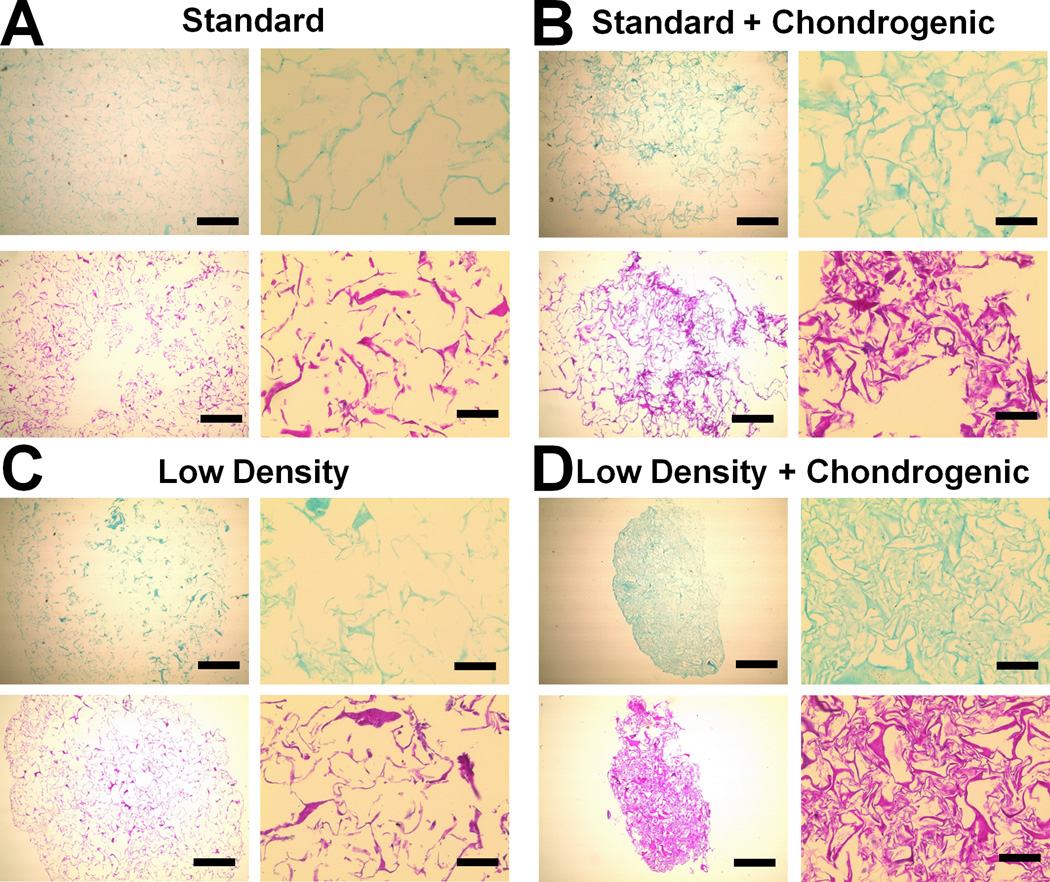
Figure 8. Alcian blue and H&E analysis of GAG synthesis and cell distribution.
Representative histology sections from day 21 time point reveal higher GAG content and cellular condensation in the Low Density + Chondrogenic group. A) Standard, B) Standard + Chondrogenic, C) Low Density, D) Low Density + Chondrogenic. Scale bars: 500 µm (4× objective images on left), 100 µm (20× objective images on right).

