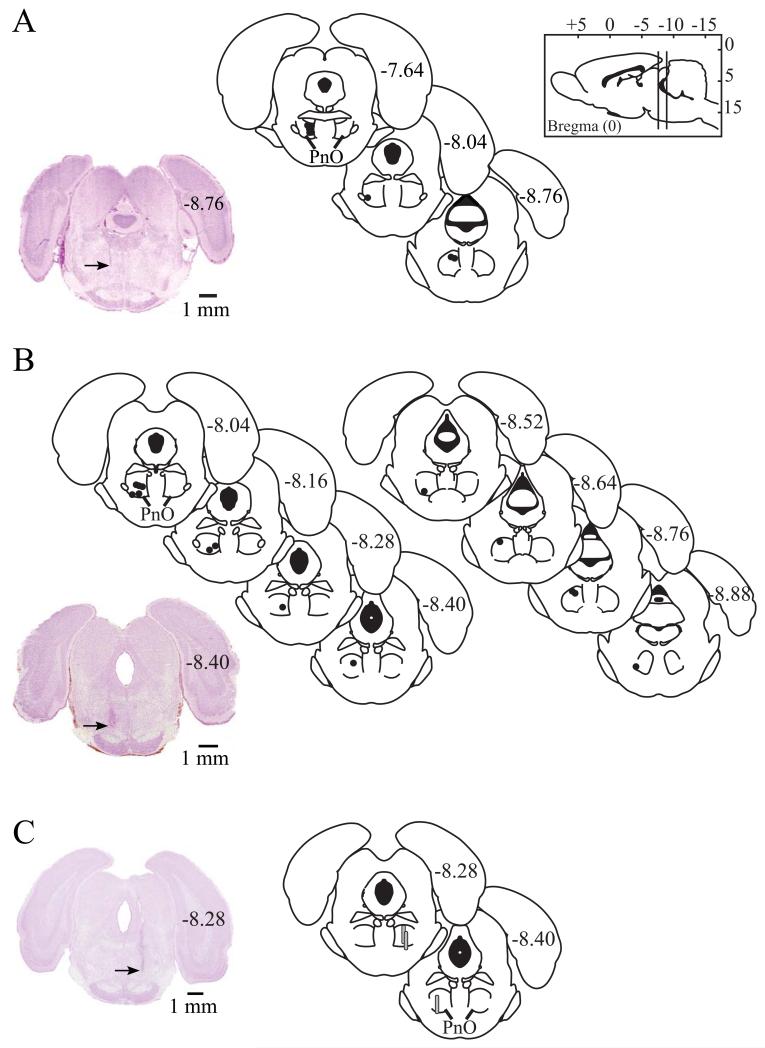
Figure 4.
Microinjection and microdialysis sites were localized to the oral pontine reticular nucleus (PnO). The sagittal drawing of the rat brain (top right) contains vertical lines that illustrate the anterior-to-posterior range of all microinjection and microdialysis sites. Microinjection sites from the isoflurane study (A) and the propofol study (B) are represented by black dots on coronal schematics modified from a rat brain atlas (Paxinos & Watson, 2007). Numbers on the right side of each schematic indicate mm posterior to bregma. The tissue sections at bottom left of parts A and B show representative brain stem sections stained with cresyl violet. Arrows on each section indicate a microinjection site in the left PnO. Coronal schematics (C) of rat brain stem modified from a rat brain atlas (Paxinos & Watson, 2007) show the location of each microdialysis membrane, drawn to scale as gray cylinders. Histological analysis also confirmed that GABA measures were obtained from the PnO. The coronal stained section to the right shows a representative microdialysis site in the right PnO. The arrow indicates the deepest portion of the microdialysis site.

