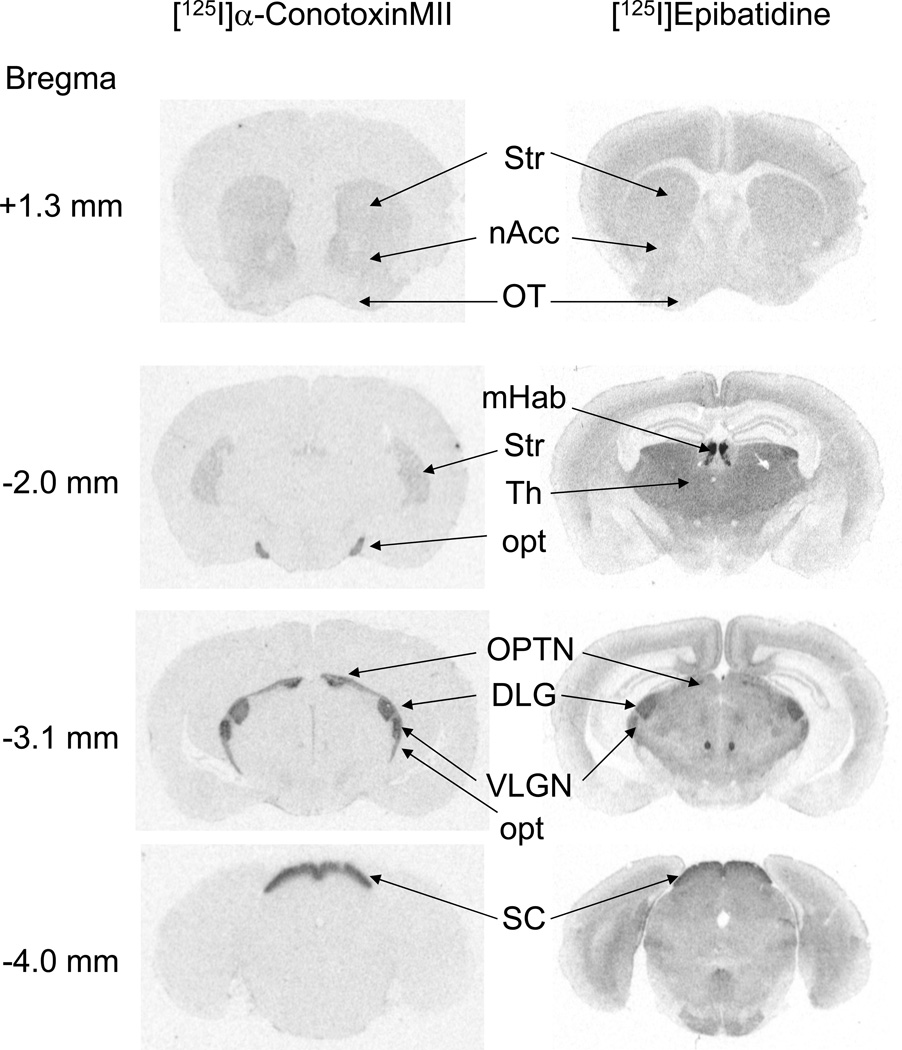
Figure 1. Autoradiograms of [125I]α-conotoxinMII ([125I]α-CtxMII) and [125I]epibatidine binding.
Representative examples are shown of radioligand binding patterns, recorded on X-ray film, using autoradiography approaches as described in the Methods section. Left column: [125I]α-CtxMII (500 pM) labeling. Right column: [125I]epibatidine (200 pM). Regions of interest are labeled as follows: DLG, dorsolateral geniculate nucleus; mHab, medial habunula; nAcc, nucleus accumbens; opt, optic tract; OPTN, olivary pretectal nucleus; OT, olfactory tubercle; SC, superior colliculus (superficial layers); Str, striatum; Th, thalamus; VLGN, ventrolateral geniculate nucleus.

