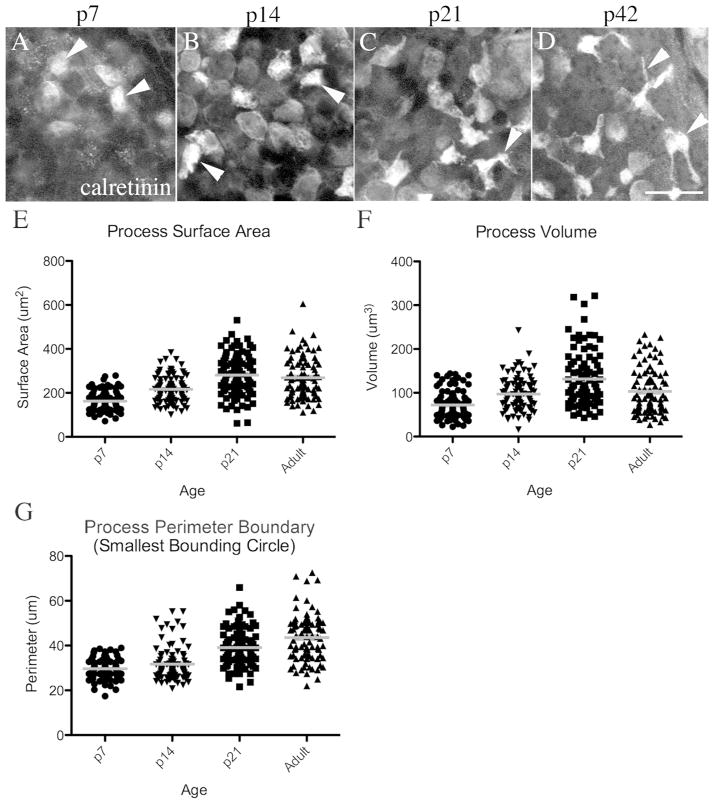
Figure 10.
Type II hair cell processes develop postnatally. A–D. Confocal horizontal slices of calretinin-labeled adult mouse utricles, focused on the epithelial layer where the type II hair cell processes are seen in adults (between the type I hair cell bodies and the supporting cell nuclei). The arrowheads point to examples of calretinin-labeled type II hair cell cytoplasm in this layer. E–G. Graphs show the distribution of measurements for process surface areas (E), process volume (F), and process perimeter boundary (G). Each point represents an individual cell, and the gray line represents the mean for each group of cells. Scale bar in D = 10 μm (applies to A–D).

