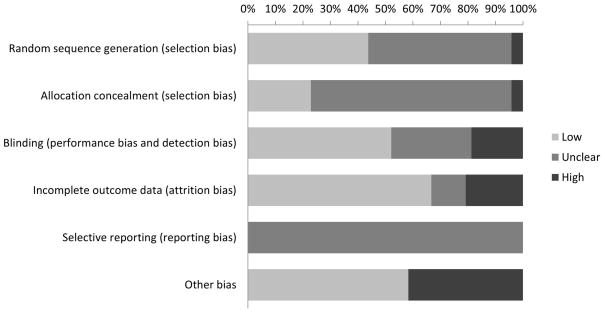
Figure 2. Risk of bias among included studies (N=48).
“Other bias” included bias potentially introduced by using different adherence measures across intervention groups, not accounting for clustering in analysis, contamination of the control group, not accounting for baseline differences between the intervention and control group, and using different outcome measures over the course of study follow-up.

