
Figure 5.
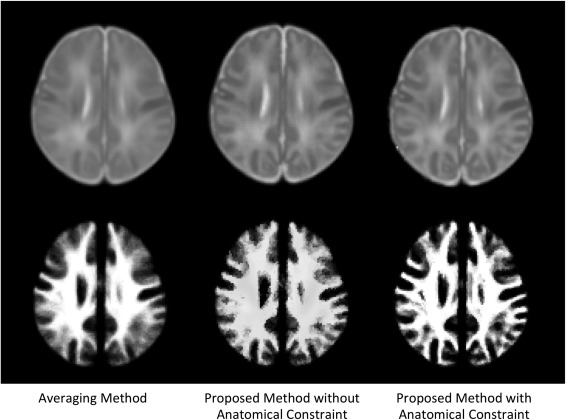
Comparison of atlas construction results by the averaging method and our proposed method without/with anatomical constraint. Top row is the intensity images from the constructed atlases, and the bottom row is WM probability maps.
Official websites use .gov
A
.gov website belongs to an official
government organization in the United States.
Secure .gov websites use HTTPS
A lock (
) or https:// means you've safely
connected to the .gov website. Share sensitive
information only on official, secure websites.
Comparison of atlas construction results by the averaging method and our proposed method without/with anatomical constraint. Top row is the intensity images from the constructed atlases, and the bottom row is WM probability maps.