
Figure 9.
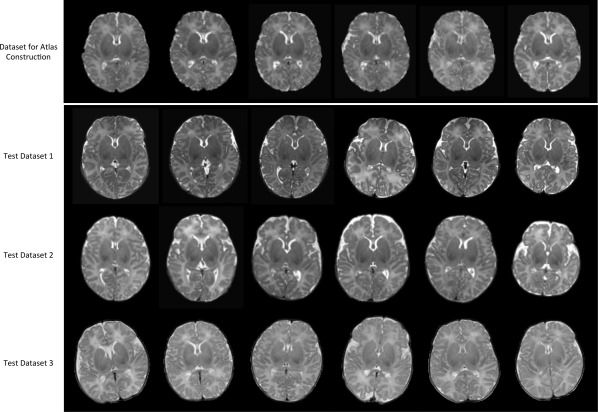
Axial views for the six randomly selected subjects in each of four neonatal datasets. Note that the images in top row were already aligned together and used as the input to our atlas construction method, while images in other three rows are displayed in their native spaces, used for quantitative evaluation.