
Figure 2. Effect of Ischemia on Morphology.
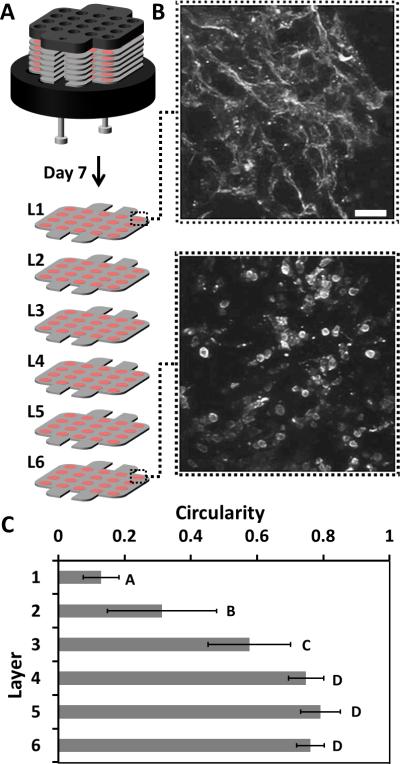
A-B) Confocal, immunofluorescence images of the sarcomeric α-actinin in cardiomyocytes within a single zone of layer 1 (the top layer) and layer 6 (the bottom layer) of the stack after 7 days of culture. Scale bar: 50 μm. Inset Scale Bar: 10 μm. C) Graph of the average circularity of a set of 9-12 cells chosen at random from a single zone in each layer of the stack. Error bars are a S.D. of 9–12 cells in each layer, averaged between two different stacks. Means with different letters are significantly different based on Holm-Sidak method, (P = <0.001). Detailed statistics of each value available in the SI.