
Figure 4. Role of TGF-β Signaling in Invasion of Cardiac Fibroblasts.
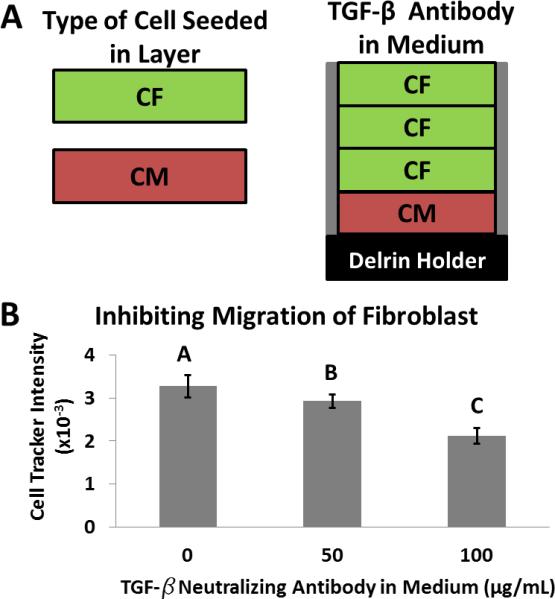
A) Schematic of a stack consisting of layers of cardiomyocytes and cardiac fibroblasts. B) Values of fluorescence intensity of fibroblasts, labeled with Cell Tracker Orange, that migrated into the adjacent layer of cardiomyocytes. Each condition is in the presence of a different concentration of TGF-β neutralizing antibody, for three days in a stacked culture. Error bars are the standard deviations for 20 replicates. Means with different letters are significantly different based on Holm-Sidak method, (P = <0.001). Detailed statistics of each value available in the SI.