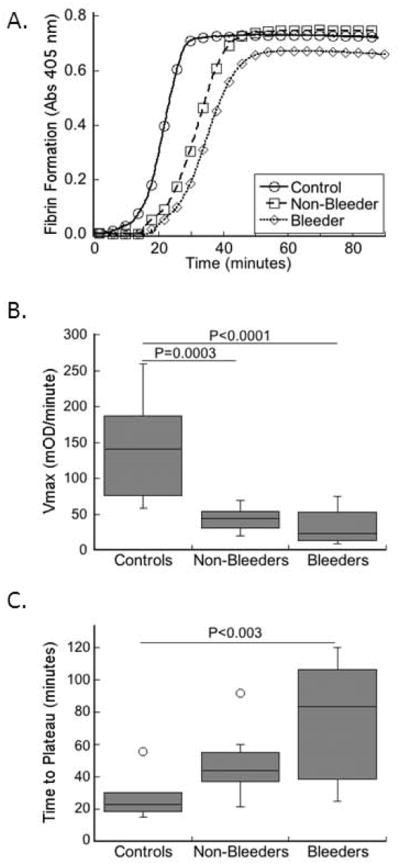
Figure 1. Plasma clot formation correlates with bleeding risk in FXI-deficient patients.

Clotting was triggered in plasmas from healthy individuals and FXI-deficient patients in a blinded fashion by recalcification and addition of TF and phospholipids. Clot formation was monitored by turbidity. A) Representative clot formation curves. B) Rate (Vmax) of clot formation in controls and FXI-deficient patients (non-bleeders and bleeders, as indicated). C) Time to plateau of turbidity in controls and FXI-deficient patients (non-bleeders and bleeders, as indicated). The boxes enclose 50% of the data with the median value displayed as a horizontal line, and lines enclose the interquartile distance (IQD). Open symbols represent points whose value falls more than 1.5-fold outside the IQD.
