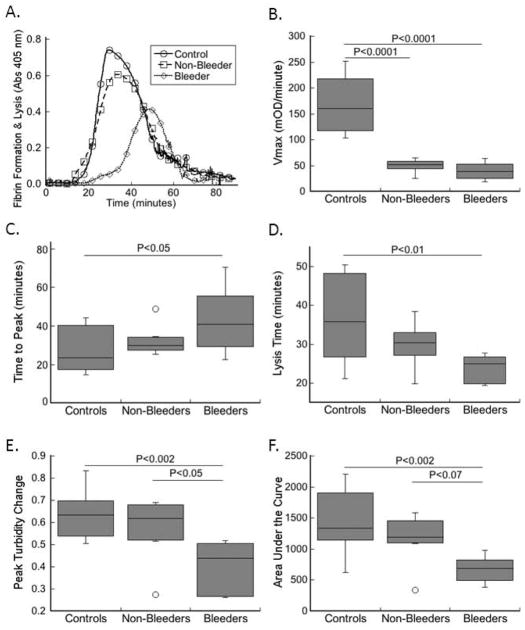
Figure 3. Plasma clot stability correlates with bleeding risk in FXI-deficient patients.
Clotting was triggered by recalcification and addition of TF and phospholipids in the presence of t-PA in a blinded fashion. Clot formation and lysis were monitored by turbidity. A) Representative clot formation and lysis curves. B–F) Values for: B) rate (Vmax), C) time to peak turbidity, D) lysis time, E) peak turbidity change, and F) area under the clotting curve for plasmas from controls and FXI-deficient patients (non-bleeders and bleeders, as indicated). The boxes enclose 50% of the data with the median value displayed as a horizontal line, and lines enclose the IQD. Open symbols represent points whose value falls more than 1.5-fold outside the IQD.

