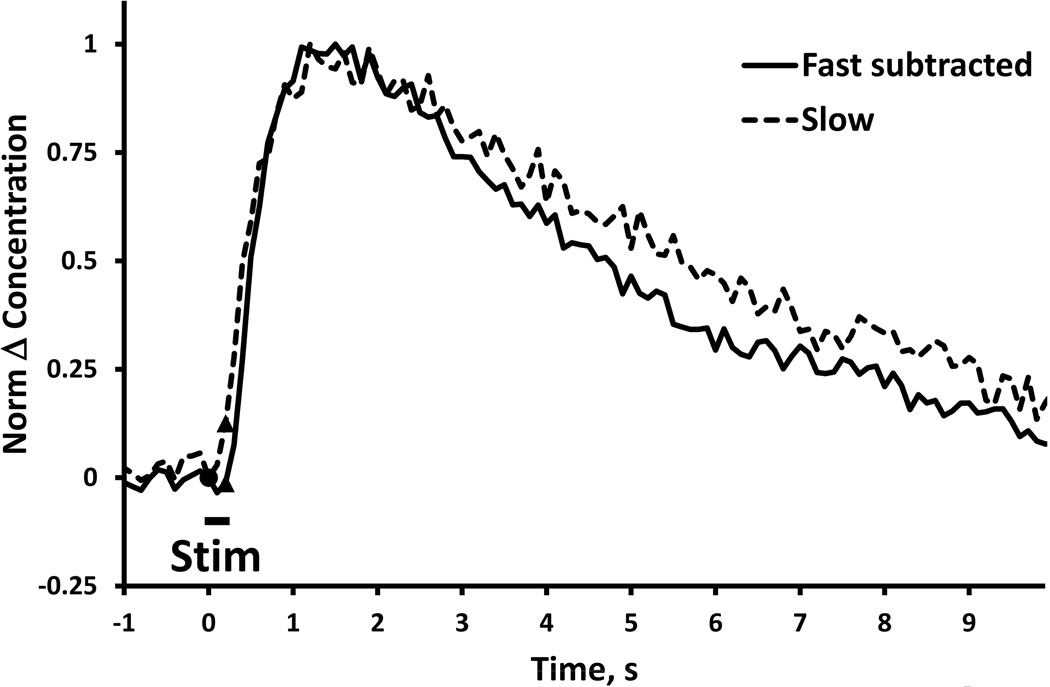
Figure 7.
Comparison of “pure overshoots” observed in fast (solid) and slow (dash) NAcc domains after nomifensine administration (stimulus = 0.2 s, 60 Hz, 250 µA). The blue line was obtained from Fig. 1a by subtracting the pre-drug response from the post-nomifensine response (see also Fig. 9 of Taylor et al., 2012). The dash line is from Fig. 3. The two responses are normalized to their maximum amplitudes to enable comparison of their temporal features (SEMs omitted for clarity).

