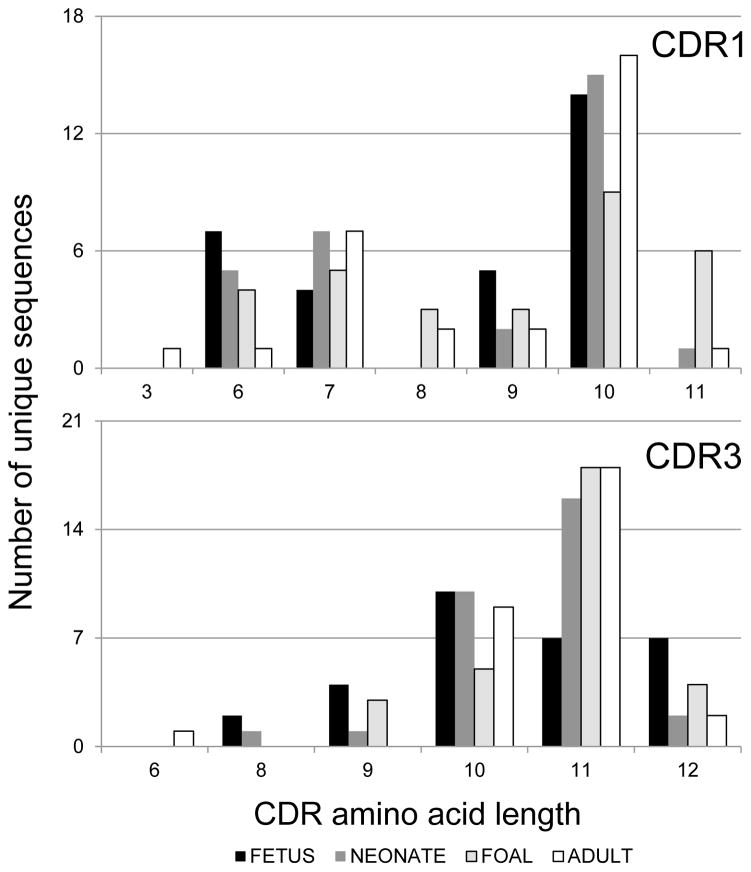
Figure 3. CDR1 and CDR3 length distribution of equine immunoglobulin lambda light chain sequences.
The length of complementarity-determining regions (CDR) 1 and 3 from unique sequences are plotted by age group. Fetal sequences are shown in black, neonatal sequences in dark gray, foal sequences in light gray with black border, and adult horse sequences in white with black border. No statistical differences were detected for CDR length distribution with respect to age.

