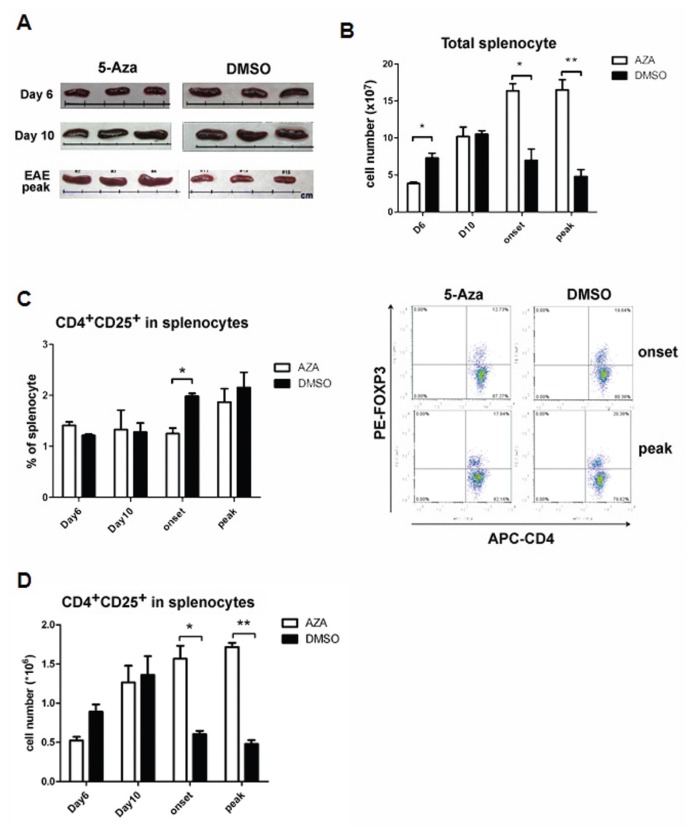
Figure 4.
Treatment of mice with 5-Aza induces distinct changes in spleen morphology and spenocyte populations during EAE progression. Mice pretreated with 5-Aza or DMSO were MOG-induced for EAE, as described in Figure 1 (n = 3–5 mice/group, two independent experiments were performed). (A) Spleens were harvested from 5-Aza-treated (left panel) or DMSO-treated (right panel) EAE mice at d 6 and 10 and disease peak after MOG induction. Each interval between bars represents 1 cm. (B) Total cell numbers of splenocytes were counted at the indicated time points (*p < 0.05, **p < 0.01; white bar: 5-Aza, black bar: DMSO). (C) Splenocytes stained with CD3, CD4 and CD25, and CD3+ cells, were gated to analyze the percentage of CD4+CD25+ T cells from 5-Aza-treated (white bars) or DMSO-treated (black bars) EAE mice at the indicated time points (left panel). Representative results from flow cytometry are also shown (right panel) (*p < 0.05). (D) The total number of CD4+CD25+ T cells in splenocytes from 5-Aza-treated (white bars) or DMSO-treated (black bars) EAE mice were counted at the indicated time points (*p < 0.05, **p < 0.01).

