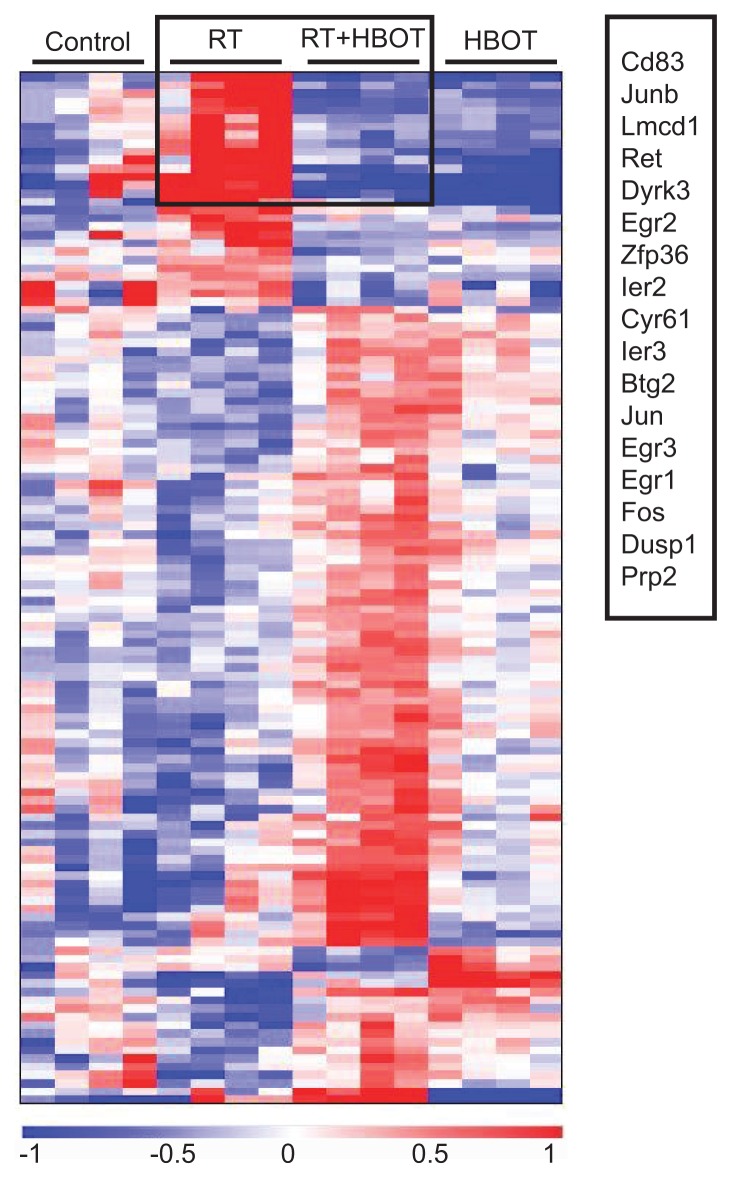
Figure 2.
Differentially expressed probe sets between the RT− and RT + HBOT group. OmniViz treescape showing the hierarchical clustering of differentially expressed Affymetrix probe sets between the submandibular glands of the RT and RT + HBOT group (middle groups). Expression of these probe sets for the control and HBOT-group is shown on the outside. Red indicates upregulated probe sets compared with the geometric mean and blue indicates downregulated probe sets compared with the geometric mean. The color intensity correlates with the degree of change. Rectangle shows probe sets that are upregulated in the RT group, while downregulated in the RT + HBOT group. Genes within this rectangle are summarized.

