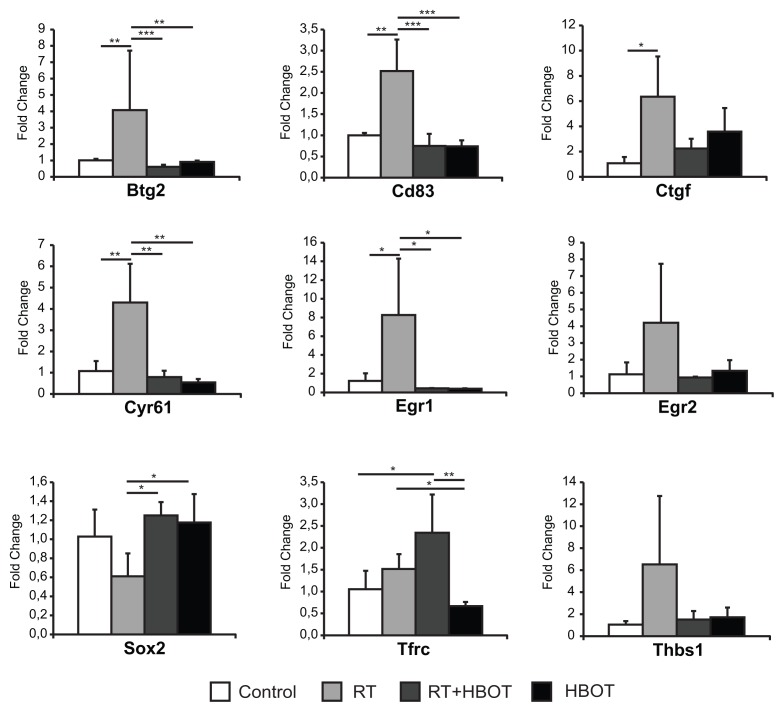
Figure 3.
qPCR validation of genes of interest. qPCR validation of microarray results for the expression of genes of interest at 2 wks after RT in the submandibular glands. y Axis shows mean fold change relative to controls. Lines above bars represent statistically significant differences (*P < 0.05, **P < 0.01, ***P < 0.001).

