Figure 4.
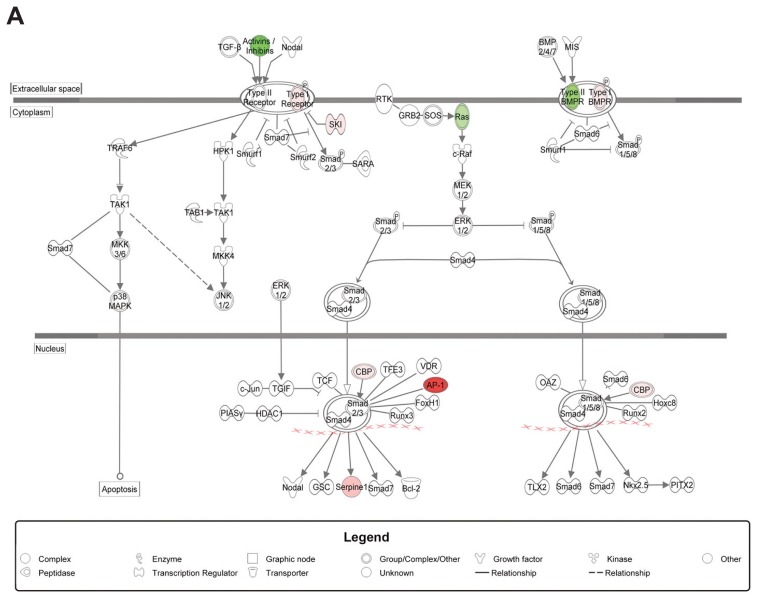
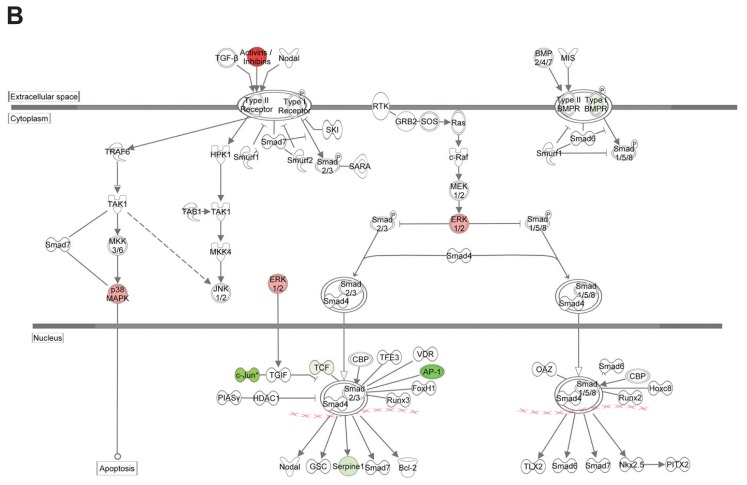
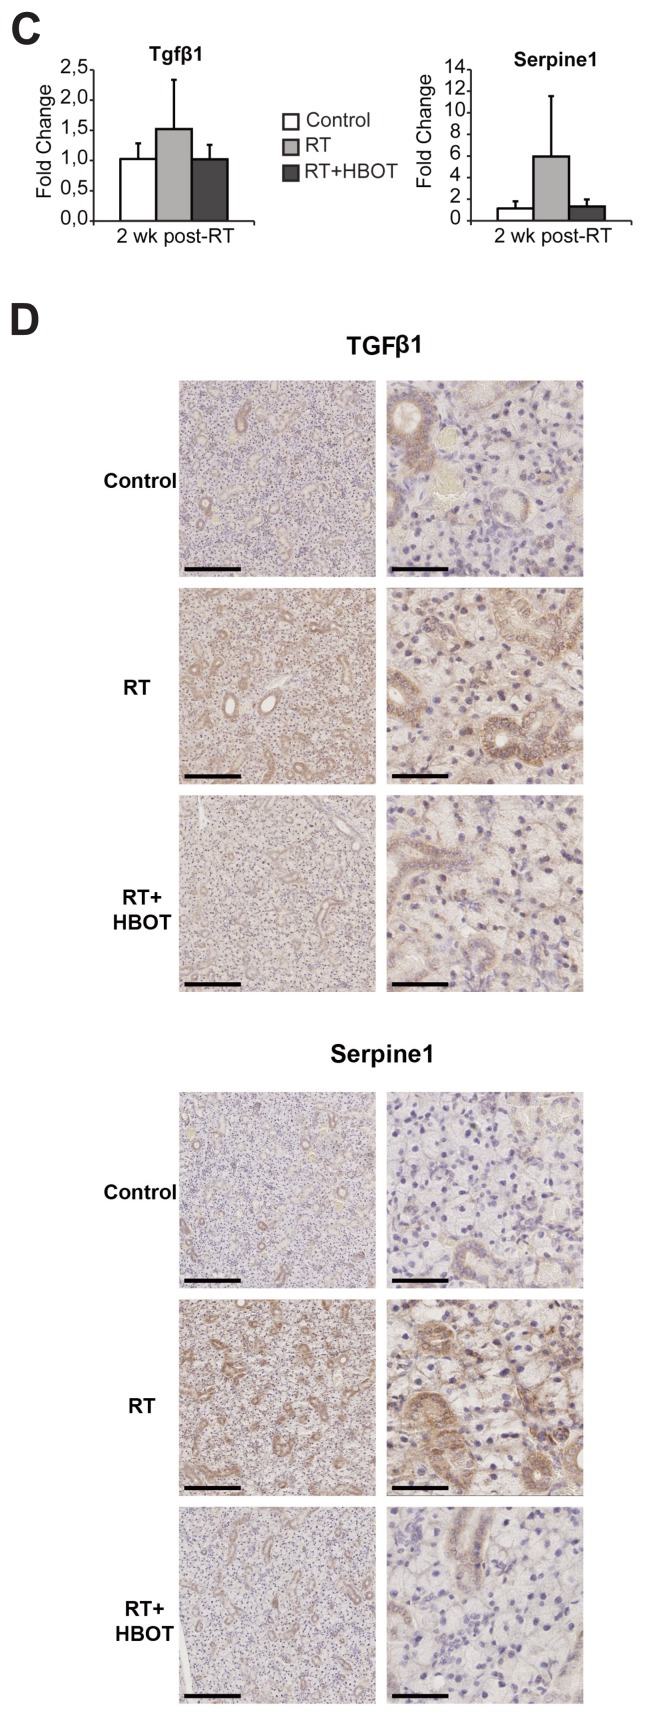
Influence of HBOT on the TGFβ-pathway. Differential expression of genes involved in the TGFβ-pathway in irradiated submandibular glands compared with control (A) and in irradiated glands that received HBOT compared with irradiated glands (B), by Ingenuity Pathway Analysis of microarray data. Colors show up- (red) and downregulated (green) genes (≥ 1.2-fold change, FDR 0.05). Notice the reverse expression of genes when HBOT is applied to irradiated glands. qPCR validation (C) and immunohistochemical staining (D) of Tgfβ1 and Serpine1 at 2 wks after RT. Scale bars left pictures 200 μm, right pictures 50 μm.


