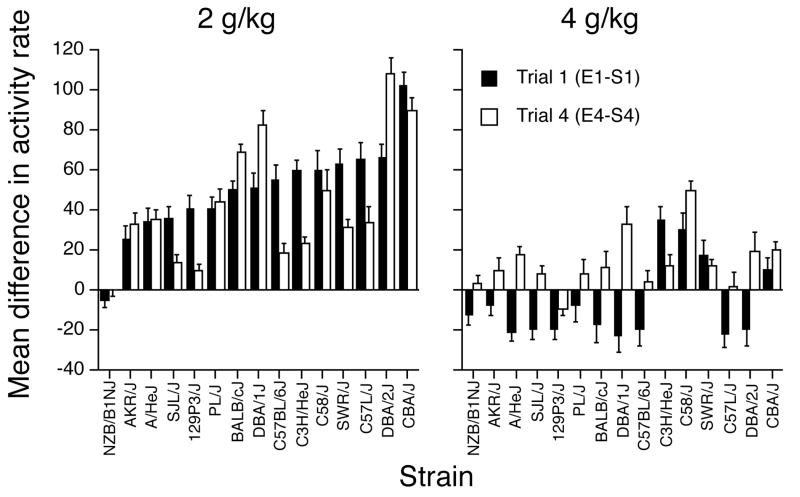
Figure 1.
Mean difference (+ SEM) in activity rate (counts per minute) between the ethanol and saline trials in the 2- (left panel) and 4- (right panel) g/kg ethanol groups on the first (solid bars) and last (open bars) pairs of conditioning trials. Activity is plotted as the difference between the ethanol and saline trials for each pair of trials (E1-S1, E4-S4). The strains are ordered according to magnitude of the trial 1 difference in the 2-g/kg groups.

