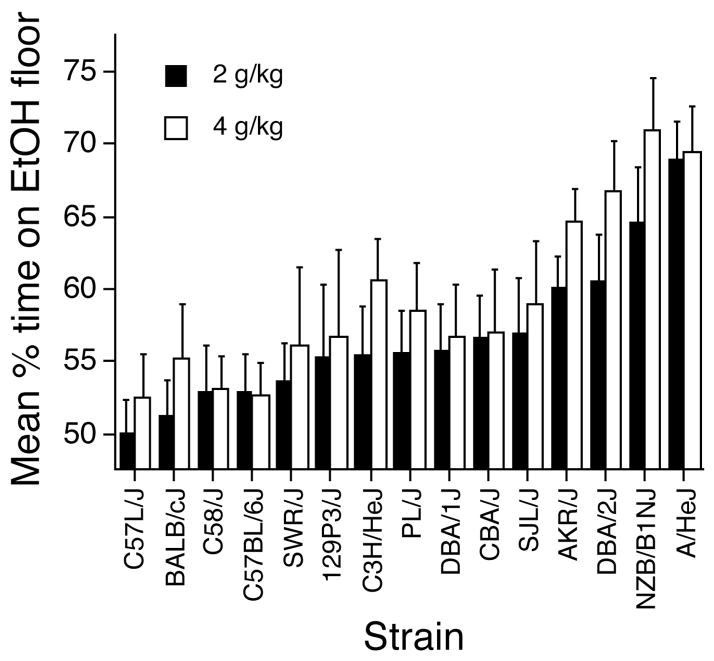
Figure 2.
Mean percent (+ SEM) time spent on the ethanol-paired floor by the 2- (solid bars) and 4- (open bars) g/kg ethanol groups during the 30-min preference test. Data are collapsed over conditioning subgroups (i.e., GRID+ vs. GRID−) within each strain. Strains are ordered according to magnitude of effect in the 2-g/kg ethanol groups.

