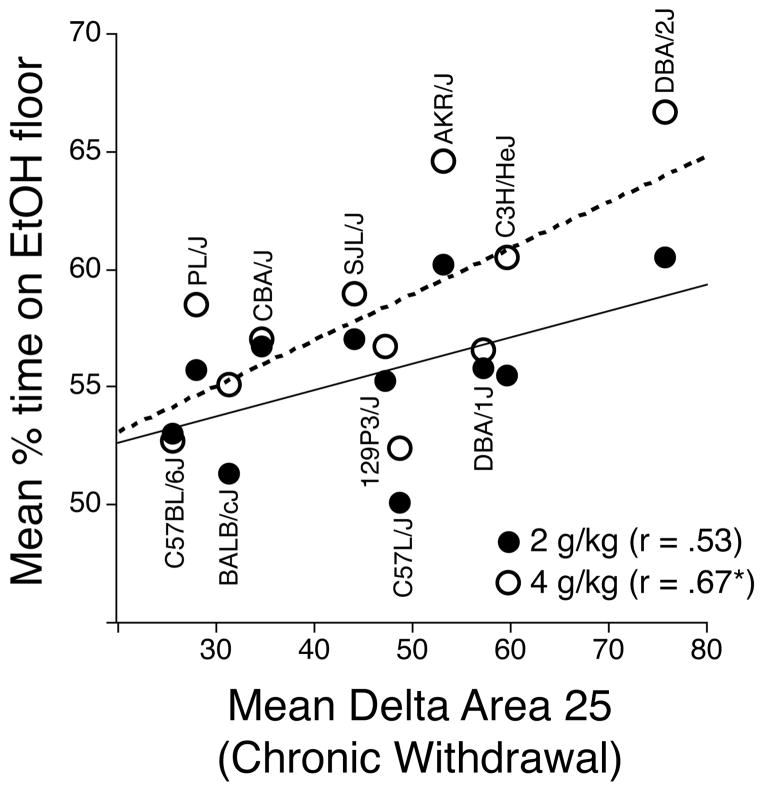
Figure 4.
Scatterplot showing the genetic correlations between mean percent time on the ethanol-paired floor (y-axis) and chronic ethanol withdrawal for the 2- (solid symbols, solid line) and 4- (open symbols, dashed line) g/kg groups. Each point represents the strain mean scores for both phenotypes. The points for each strain are arranged vertically. Means for Chronic Withdrawal (mean delta area 25) are from Metten & Crabbe (2005).

