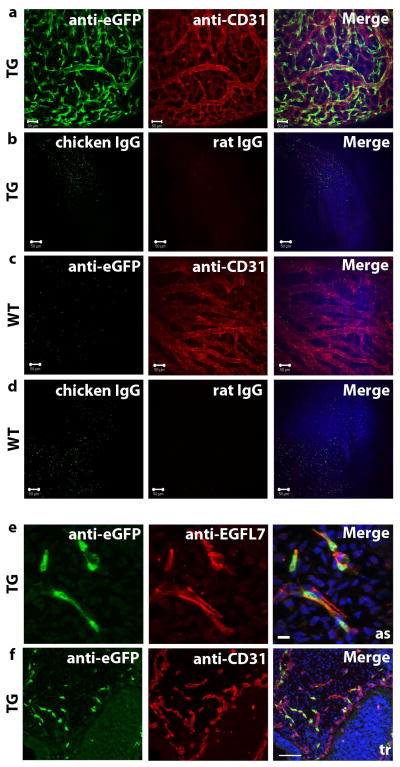
Figure 3. Egfl7:eGFP marks the developing vasculature and faithfully recapitulates endogenous EGFL7 expression.
a–b) Whole mount staining of E10.5 transgenic (TG) embryos (scale bar = 50 μm), head vasculature shown. a) Anti-eGFP and anti-CD31. b) IgG controls. c–d) Whole mount staining of E10.5 wild type (WT) embryos (scale bar = 50 μm), head vasculature shown. c) Anti-eGFP and anti-CD31. d) IgG controls. e) Anti-EGFL7 (red) and anti-eGFP (green) immunofluorescence staining of sections of an E9.5 transgenic embryo (scale bar = 10 μm). eGFP expression is restricted to EGFL7-expressing cells. as = aortic sac. f) Anti-CD31 (red) and anti-eGFP (green) immunofluorescence staining of sections of and E9.5 transgenic embryo (scale bar = 100 μm). tr = trunk.

