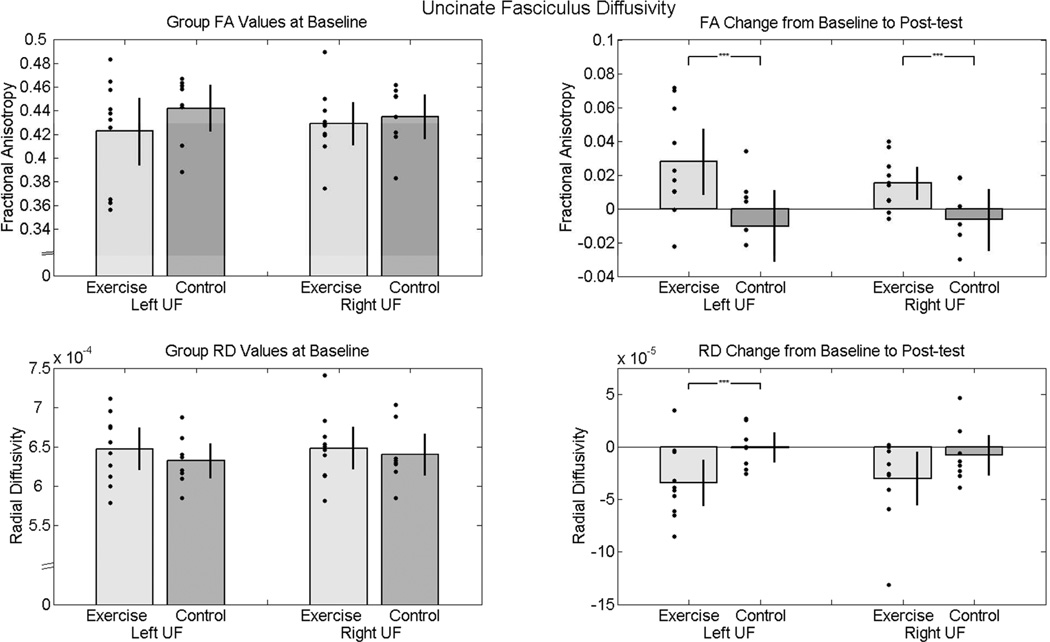
Figure 2.
Diffusivity values of uncinate fasciculus at baseline and post-test. The bar graphs show mean diffusivity values for each group (gray and dark gray bars) and standard error bars with individual data points (black dots) overlaid. The left panel shows that the two groups did not significantly differ in left or right uncinate fasciculus white matter integrity (FA and RD) at baseline. The right panel illustrates the increase from baseline to post-test in white matter integrity (increased FA and decreased RD) in the exercise group as compared to the control group. The black brackets with asterisks indicate a significant t test at alpha = .05 (controlled for race and gender).

