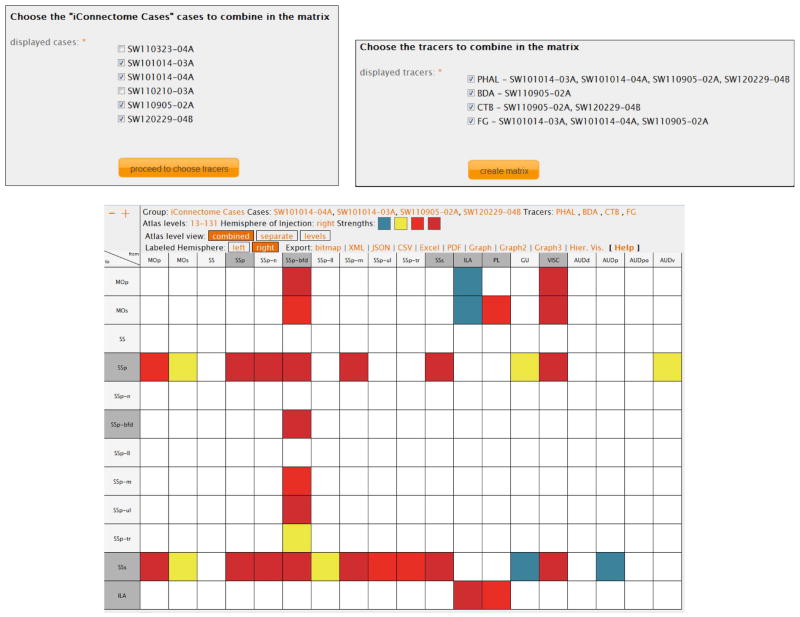
Figure 4.
An example of Workspace functionality. Registered users can choose subsets of their inserted cases (left inset) and can further refine their search by choosing specific tracers (right inset). Only the connections associated with the selected cases and tracers will be displayed. The default display shows all this data in matrix format. See Text for details regarding the functionality of the icons displayed in the header of the matrix. The view mode of the data in this Figure is “combined”, which is encoded in the Atlas Level View header (white font and orange background).

