
Figure 6.
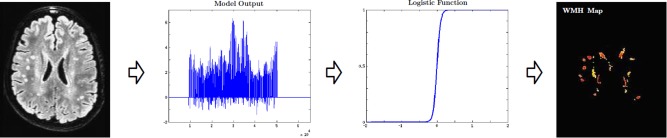
Final WMH segmentation maps. Depending on the method used the segmentation outputs are either distance maps (SVM) or empirical distributions (RF). The final WMH map is obtained by registering these outputs. Range of the final WMH maps is [0, 1] with 0 denoting a non‐WMH, and 1 a WMH. [Color figure can be viewed in the online issue, which is available at http://wileyonlinelibrary.com.]