
Figure 7.
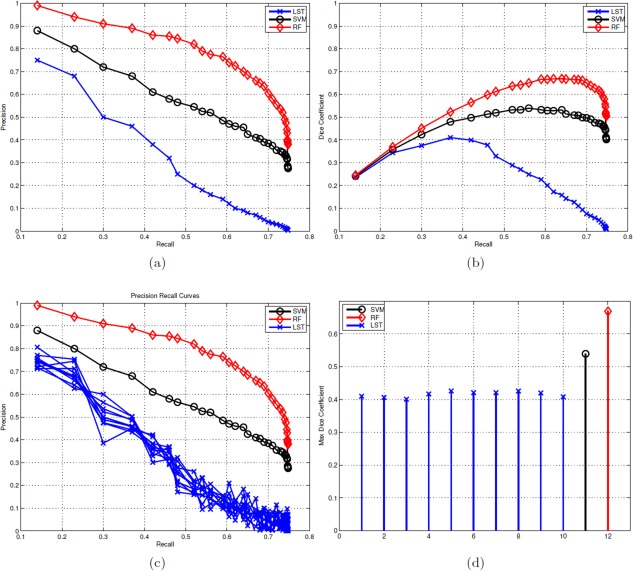
Precision versus recall (PR) curves, dice coefficient versus recall (DR) curves and F measures. (a) PR curves of LSTopt, SVM, and RF. (b) DR curves of LSTopt, SVM, and RF. (c) PR curves with differential initial thresholds k (including the optimal one) of LST. (d) Comparison of change in F‐measures across the multiple LST implementations (of c) with respect to that of SVM and RF. Color map for LST, SVM, and RF is blue, black, and red, respectively. Observe that the results of LSTopt are sensitive to the hyperparameter k, and the performance does not improve by changing it. These results show the improved performance of our methods over existing best unsupervised segmentation method. [Color figure can be viewed in the online issue, which is available at http://wileyonlinelibrary.com.]