
Figure 8.
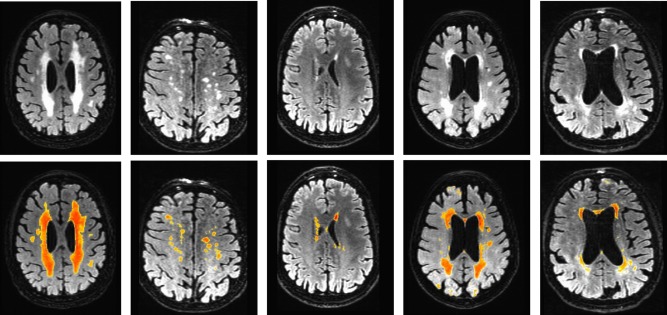
Example segmentation outputs of RF. These results show that RF method performs well both in picking up at large contiguous as well as small irregular hyperintensity regions. Fourth column shows an example of over segmentation (along cortical regions) and the last column shows a case of false negatives. The color map overlays range from blue (0) to red (1). [Color figure can be viewed in the online issue, which is available at http://wileyonlinelibrary.com.]